
Gold supported by trendline

Gold has been moving up from $1,120 to $1,244 since the end of last year. The upward movement supported both by fundamental where uncertainties kick in and from the technical side. The new bullish trend supported by trend line established from the bottom $1,120. If the price manages to bounce when it test the trendline, we will see resistance $1,250 challenge and possibly broken.
Today critical level to watch:

Support: $1,220, $1,200, $1,184, $1,180, $1,166
Resistance: $1,244, $1,250, $1,280 – $1,300
Silver no trendline touch yet
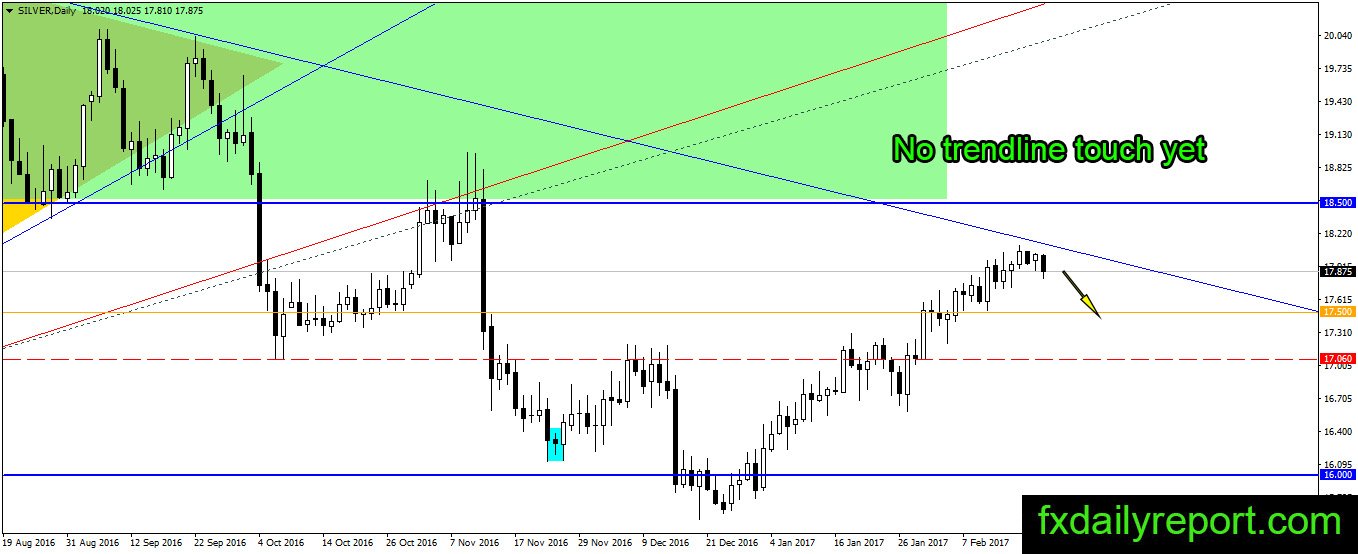
No touch yet on the Silver bearish trendline. The price is moving shy below it and slowly building bearish momentum. If the market decides to bring the price down, traders will look for a long opportunity at $17.50 and $17.00.
Today critical level to watch:
Support: $17.50, $17.20, $17.00, $16.75
Resistance: $18.00, $18.50
Crude oil slow movement

Higher lows formation confirmed the intention of crude oil to break upside. The ascending triangle pattern soon will reach an end with the range get tighter. A long trade is favorable as the pattern usually break upside, the safest stop loss level located at $50 while a stop below $51.22 might be enough.
Today critical level to watch:
Support: $52.40, $51.93, $50.50, $50.00, $49.60
Resistance: $54.50, $55.00