
Gold cross the line

Finally reached the $1,250 handle, gold continues further upside above the resistance. The close last week above $1,250 open the way toward $1,280 – $1,300 resistance, and it looks like the price will continue further.
A long trader who already bought position in gold could hold position and looks for initial take profit level between $1,280 – $1,300. The rest of position could be held for long-term as the precious metal enter a period of uncertainties.

Today critical level to watch:
Support: $1,250, $1,244, $1,220, $1,200, $1,184, $1,180
Resistance: $1,280 – $1,300
Silver the path is clear
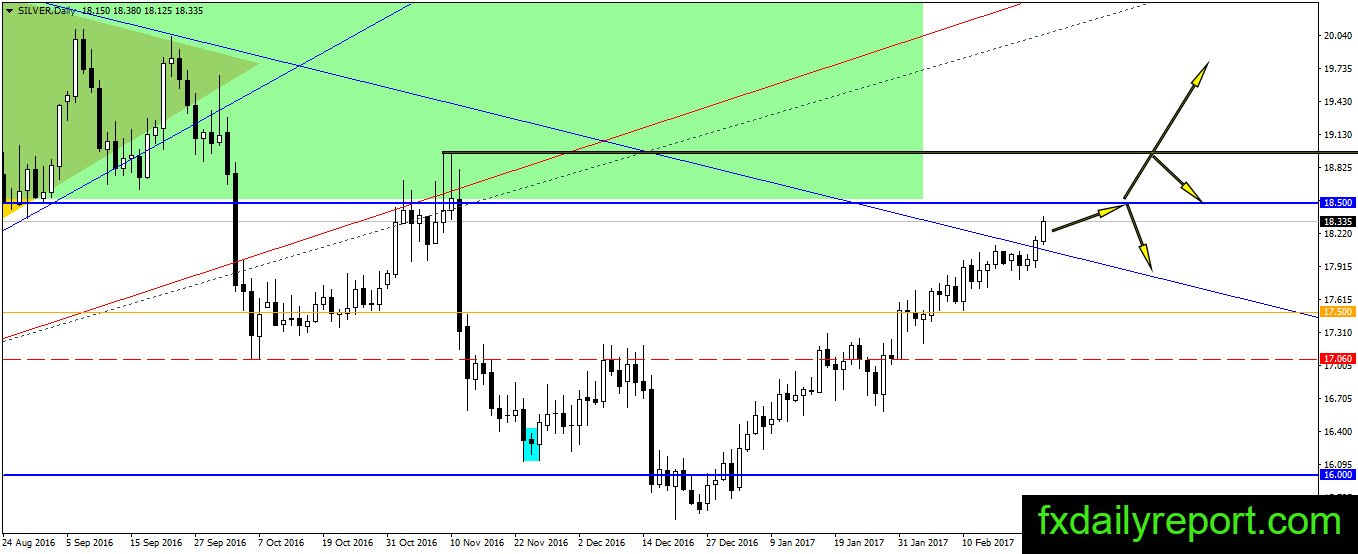
It is clear for the silver next move. The price should reach $18.50 and possibly continue further above it. On the upside, we have $18.90 – $19.00 resistance level to break. On the downside, support seen at the broken trendline.
Today critical level to watch:
Support: $18.00, $17.50, $17.20, $17.00, $16.75
Resistance: $18.50, $18.90, $19.00
Crude oil no breakout yet
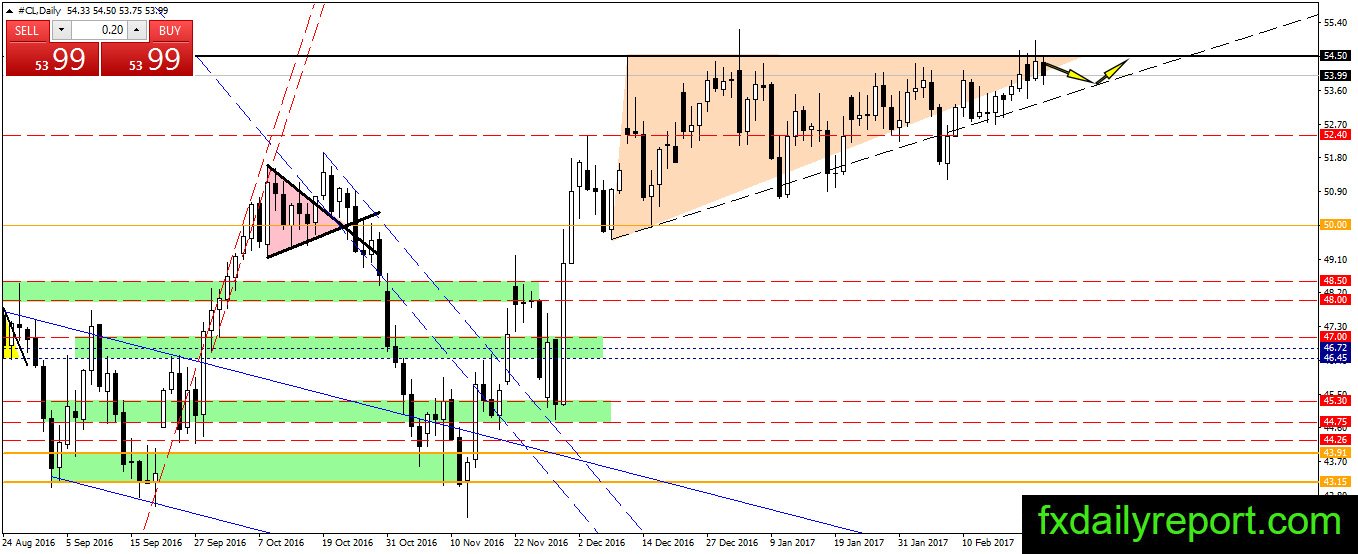
Despite the bullish pattern formed in the crude oil daily chart, there was no breakout yet. Crude oil expected to continue its consolidation movement inside the ascending triangle pattern while expecting a break upside.
Today critical level to watch:
Support: $52.40, $51.93, $50.50, $50.00, $49.60
Resistance: $54.50, $55.00