
Gold – The uptrend not done yet
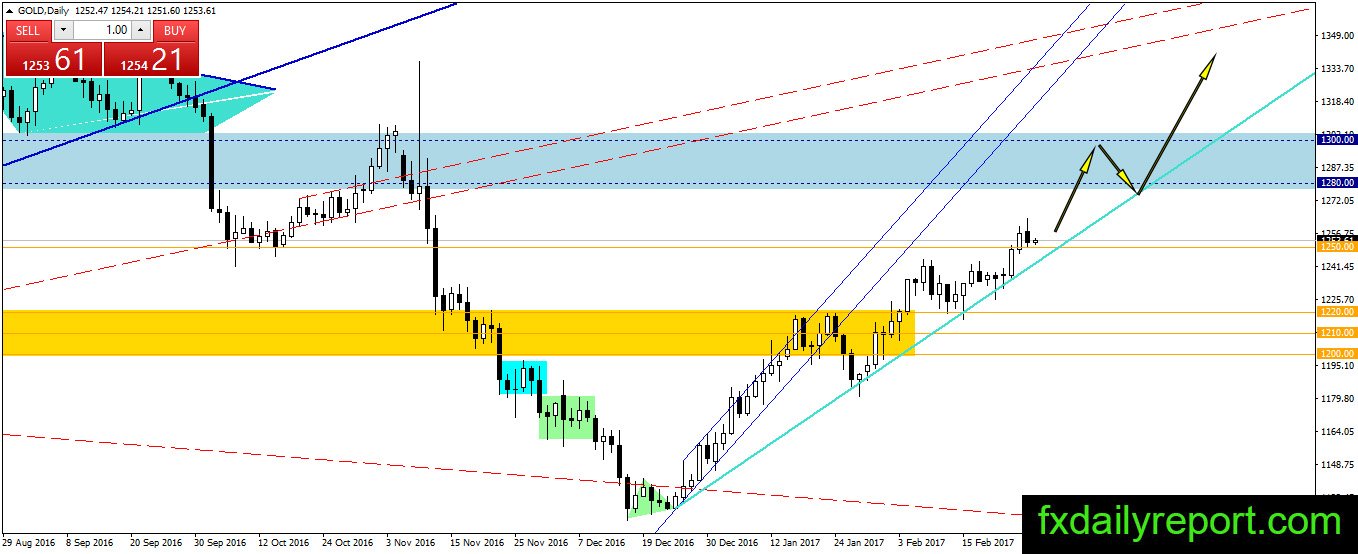
$1,250 handle in gold was broken, and the price stays above it. Today the precious metal might drift lower and test the broken resistance. If the price manages to form a bullish pattern after the test, we will see gold on the path toward $1,280 – $1,300 as planned.
A bullish trader could look for long position when the price test $1,250. A break below the blue trend line most likely will produce bear trap which is a reason to avoid short position.

Today critical level to watch:
Support: $1,250, $1,244, $1,220, $1,200, $1,184, $1,180
Resistance: $1,280 – $1,300
Silver test of $18.50
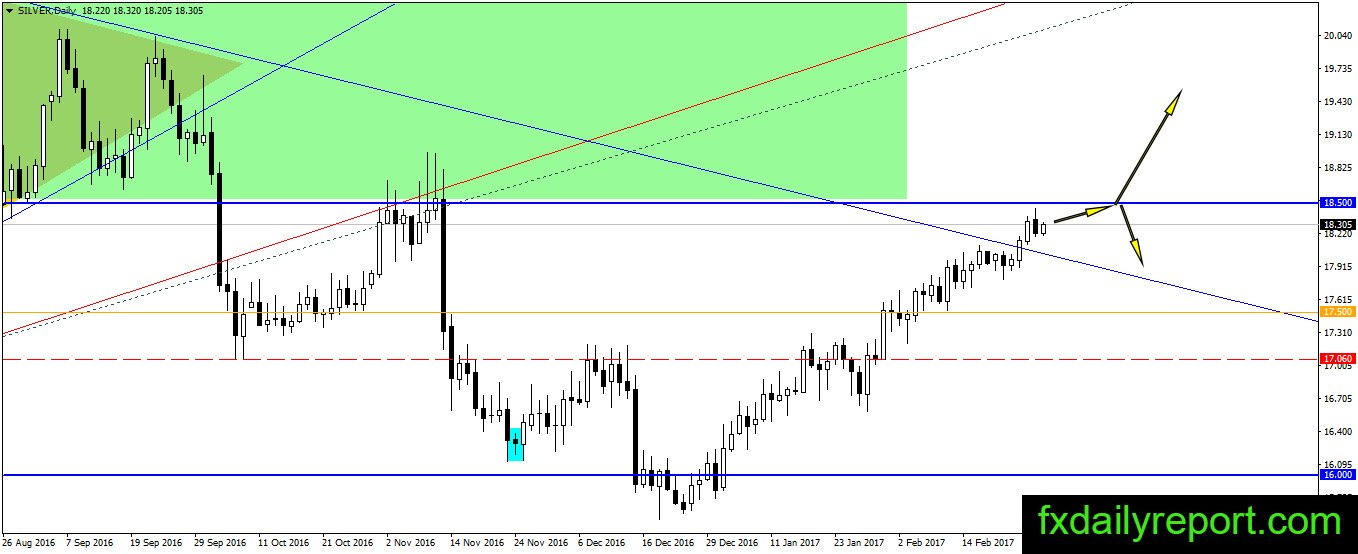
The resistance level of the silver present at $18.50. This resistance will limit all upward movement in the silver and might reverse the trend if bearish pattern form. Previous day bearish candle is the initial take profit candle which could be ignored unless another bearish candle formed, traders should continue holding a long position.
Today critical level to watch:
Support: $18.00, $17.50, $17.20, $17.00, $16.75
Resistance: $18.50, $18.90, $19.00
Crude oil no change in outlook
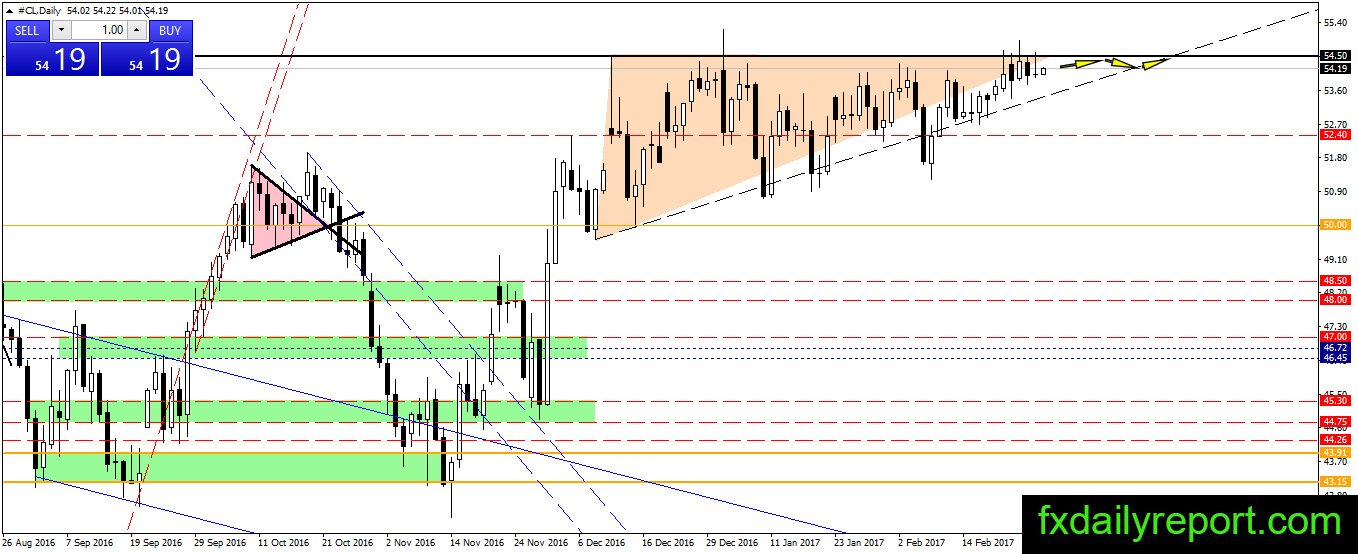
Same outlook as the previous day also previous week. The price of crude oil continue its consolidation and waiting for a breakout of the triangle. The breakout could happen anytime, and traders will wait for it.
Today critical level to watch:
Support: $52.40, $51.93, $50.50, $50.00, $49.60
Resistance: $54.50, $55.00