
Gold bullish pin bar
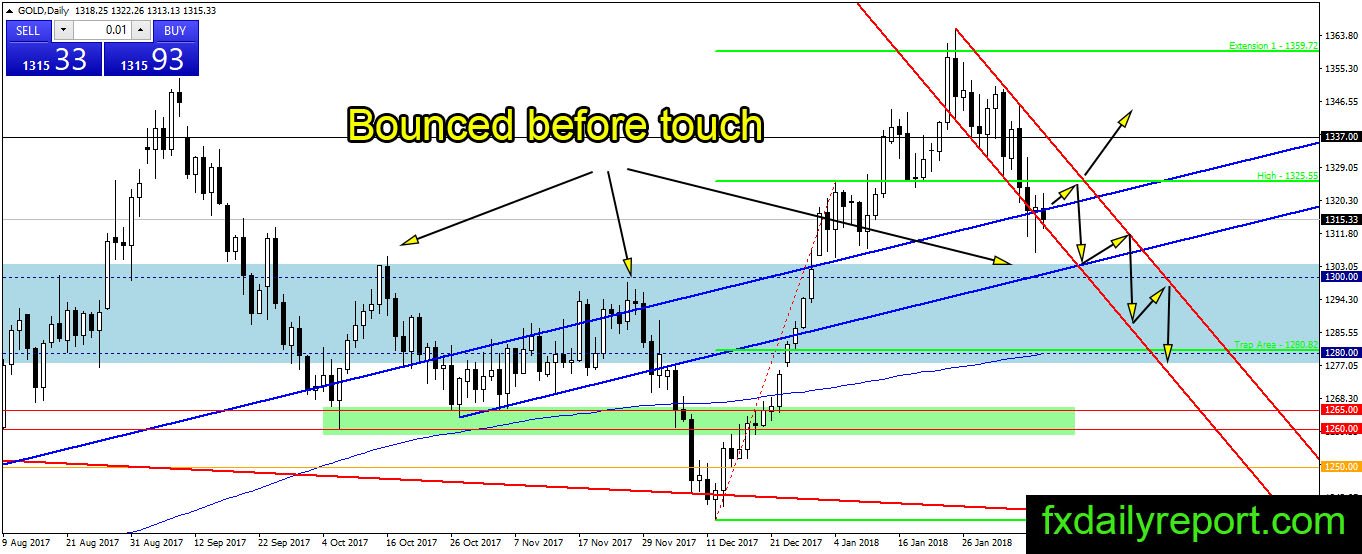
Gold fell in the early session of Yesterday, but the precious metal found support near the projected level and bounce to close above opening level. The close produce bullish pin bar pattern and indicate there is strong buying interest. However, gold hovers lower today and not followed by previous day bounce.

The price sticks inside previous day range and might close inside it. If the bull could not close the price above $1,325, we could expect gold will continue its downward movement inside the red channel.
Today critical level to watch:
Support: $1,300
Resistance: $1,320,$1,325, $1,337, $1,340
Silver sideway situation
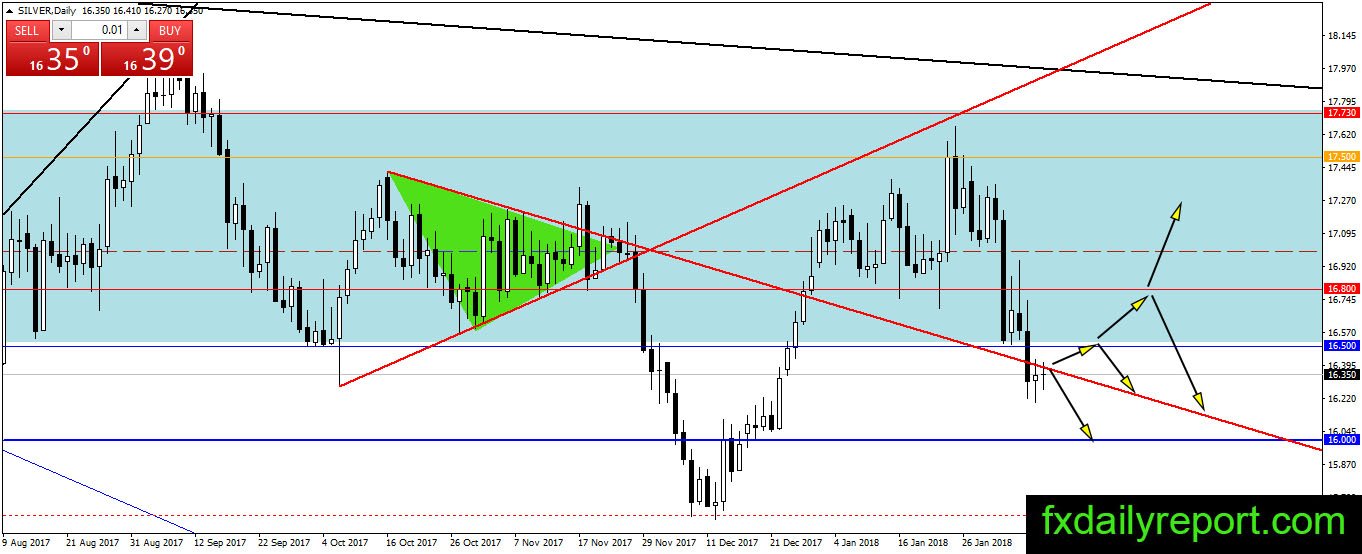
Silver is in bearish trend as it drops below $16.50. The bull did not push the price up yesterday, and the bear could not widen the distance from broken support $16.50. Today, we expect the precious metal will trade sideways until the market close.
Today critical level to watch:
Support: $16.00
Resistance: $16.50, $16.80, $17.00
Crude oil half-dollar away from support
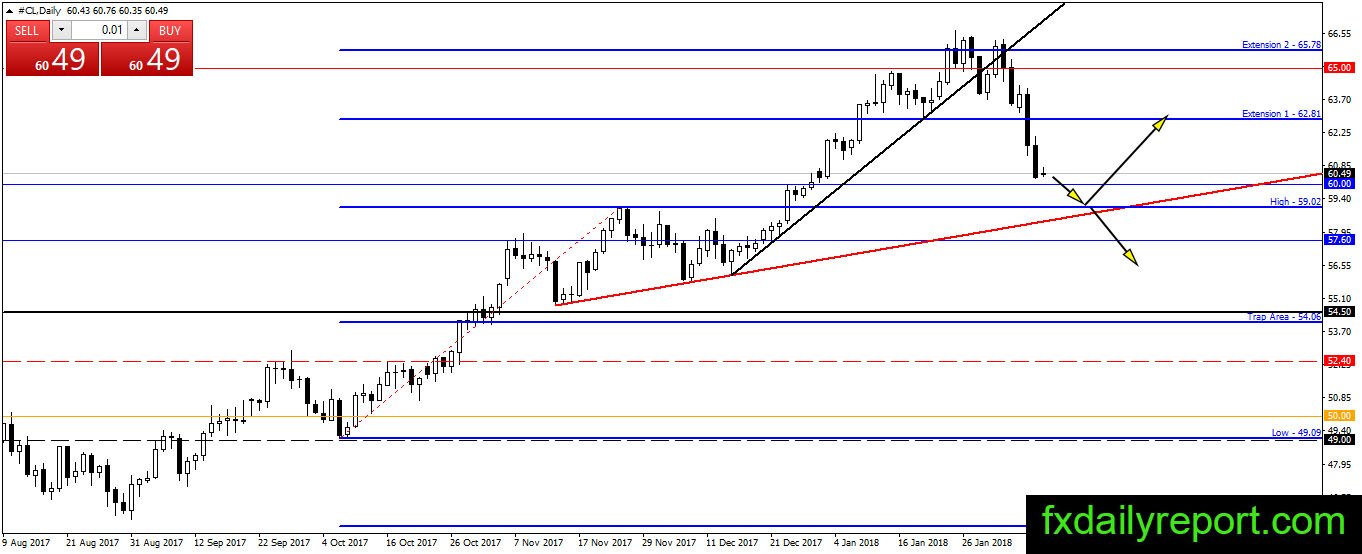
The correction of crude oil prices almost reached $59.00 – $60.00 support area. There is nothing to hold the bear from bringing the price to $59.00 – $60.00. When the price hit the area, traders could look for a long position with top below the red trendline.
Today critical level to watch:
Support: $60.00, $59.00
Resistance: $62.50, $62.80, $65.00