
Gold sideway movement
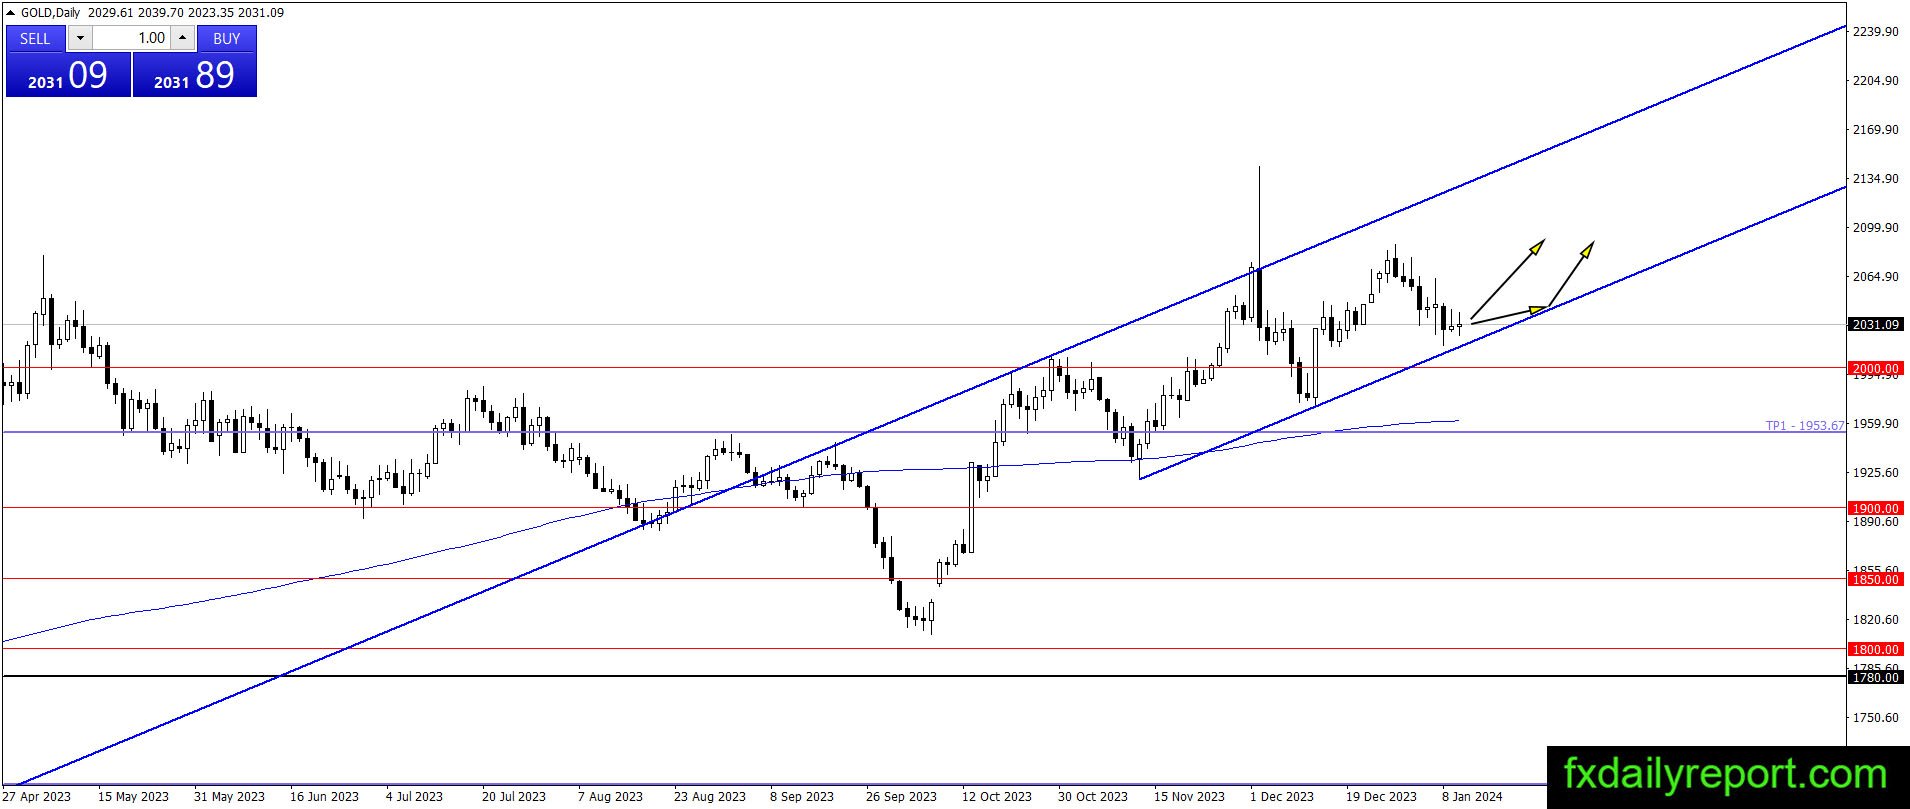
U.S. inflation data release will be a catalyst for movements in gold prices. Will gold prices bounce up and continue their bullish trend? Or will there be a decline towards SMA 200 and provide an opportunity for traders to add more long positions? On the lower side, $2,000 and the daily SMA 200 will become the level to watch.
Today’s critical levels to watch:

Support: $2,000, $1,950, $1,900, $1,850, $1,800
Resistance: $2,069, $2,074
Silver trade sideway near $23.00
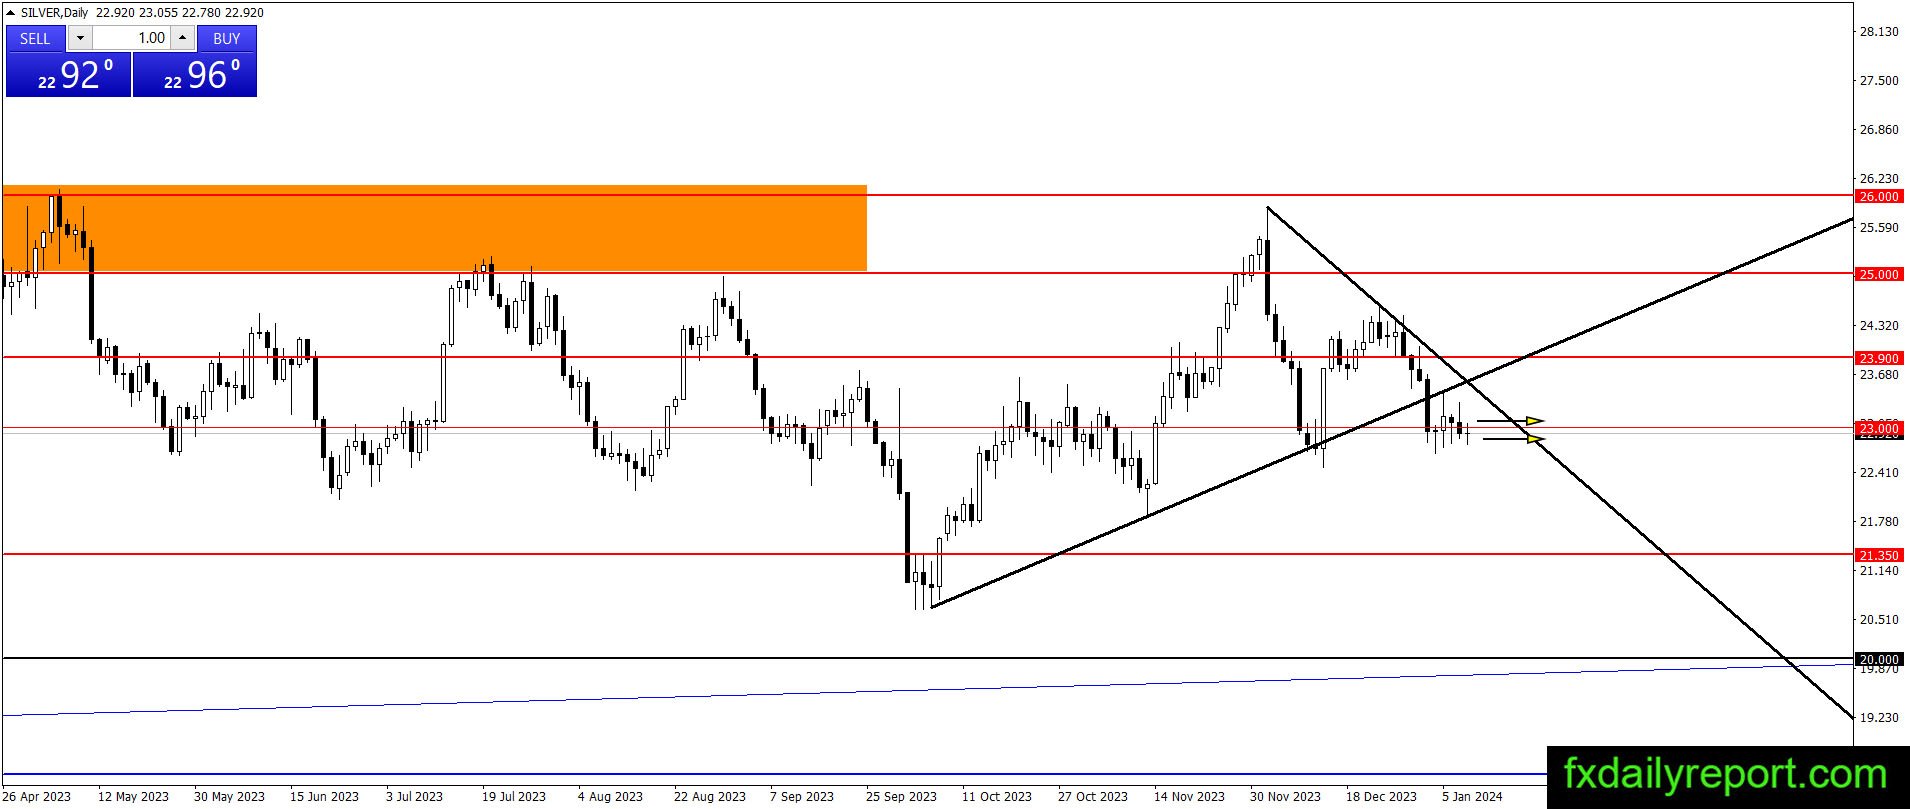
Silver price showed no significant reaction after dropping to $23.00. Currently, the price is moving sideways and traders are waiting for further reaction. When there is a bounce and rise above $23.90 then it can be a bullish confirmation for the continuation of the bullish trend.
Today’s Critical levels to watch:
Support: $23.00, $21.35, $20.00
Resistance: $23.90, $25.00, $26.00
Crude oil testing to of triangle
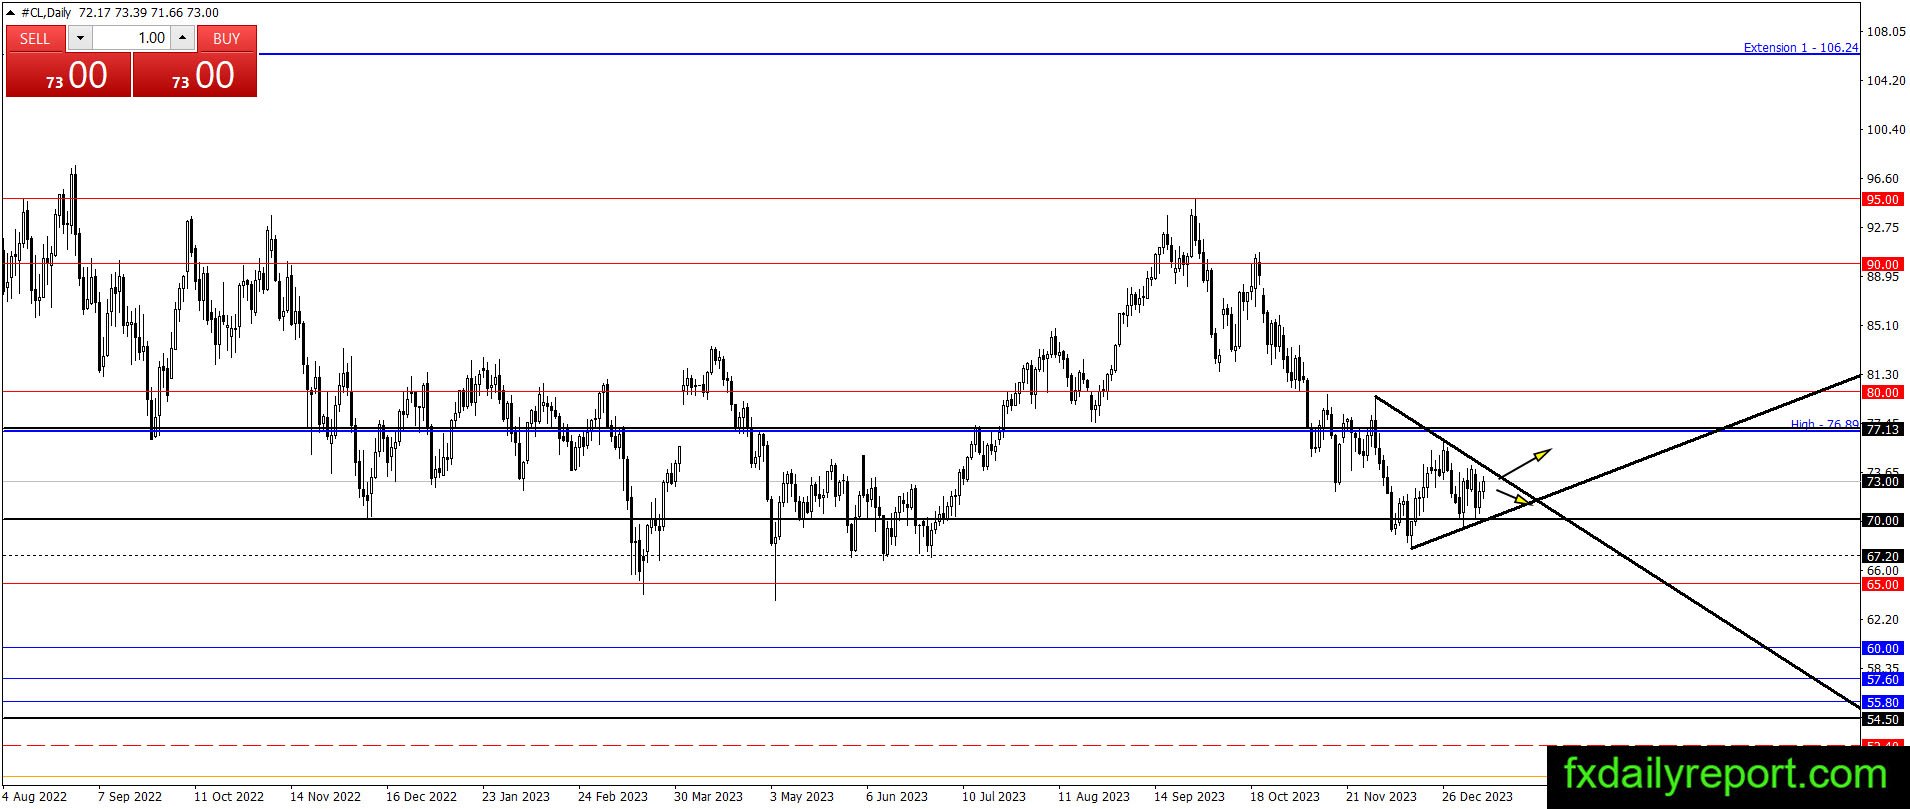
Crude oil prices are trying to move up after bouncing from the bottom of the triangle pattern. This rise will test the top of the triangle pattern and traders will wait for a reaction. When there is a close above the triangle pattern, the increase can continue toward $77.13. A close above $77.13 is needed to confirm the continuation of the long-term bullish trend.
Today’s critical level to watch:
Support: $70.00
Resistance: $77.13, $80.00, $85.00, $90.00