
Gold reversed its course

Finally the gold entered $1,200 – $1,220 range and reached the final target. This situation put the precious metal under the neutral situation, and traders will need to wait until the price gets out of the consolidation range. The bullish blue channel in daily chart still valid and will help the bull drive gold higher.

Today critical level to watch:
Support: $1,200, $1,180, $1,166, $1,160, $1,150
Resistance: $1,220, $1,250
Silver fake bullish break
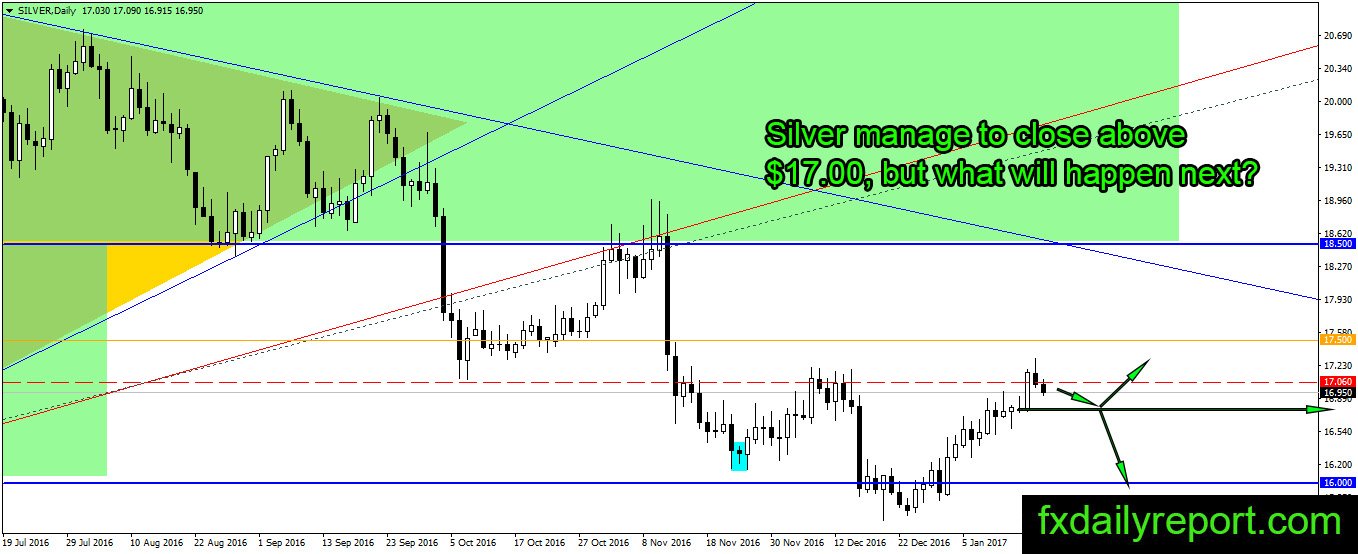
Silver price higher in the previous day, but at the end of the day it moves lower and closed inside its previous day candlestick range. Without any bullish momentum today, the precious metal might move lower toward $16.70 – $16.80 area.
Today critical level to watch:
Support: $16.75, $16.50, $16.40, $16.15, $16.00
Resistance: $17.00, $17.20
Crude Oil high-risk to move lower
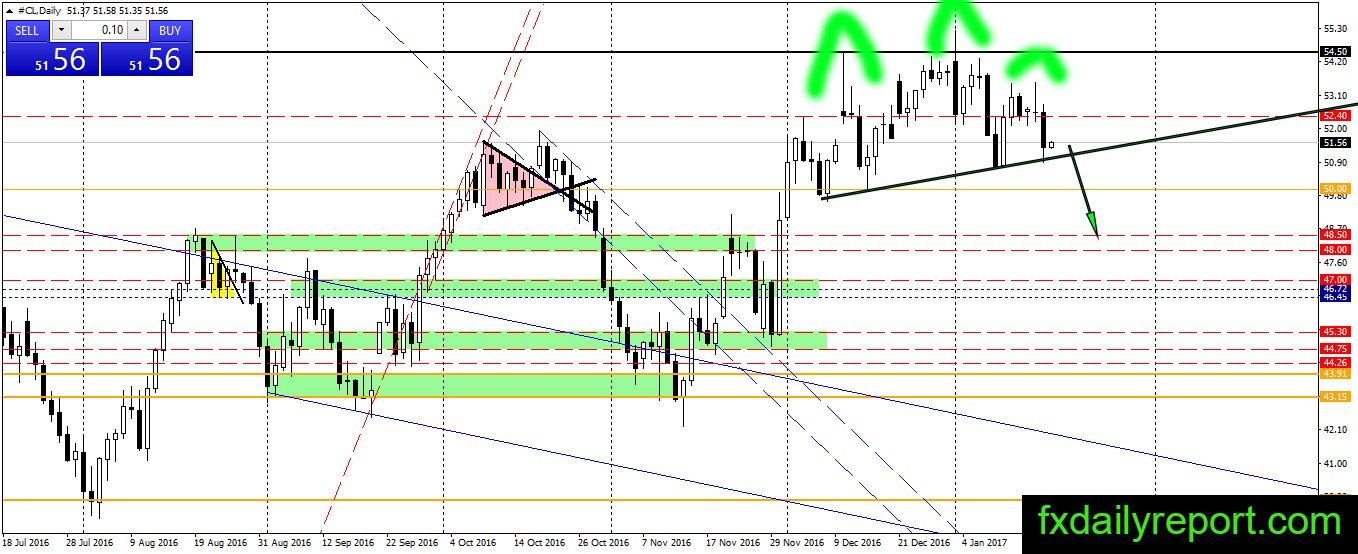
Shoulder-head-shoulder pattern formed on the daily chart of crude oil. The price cannot move higher than the $54.50 resistance level which put a risk lower. If the crude oil cannot maintain its position above the trendline or neckline, then we will see a reversal of the trend in the black gold.
Today critical level to watch:
Support: $50.50, $50.00, $49.60
Resistance: $51.93, $52.40, $54.50, $55.00