
Gold contained below $1,337
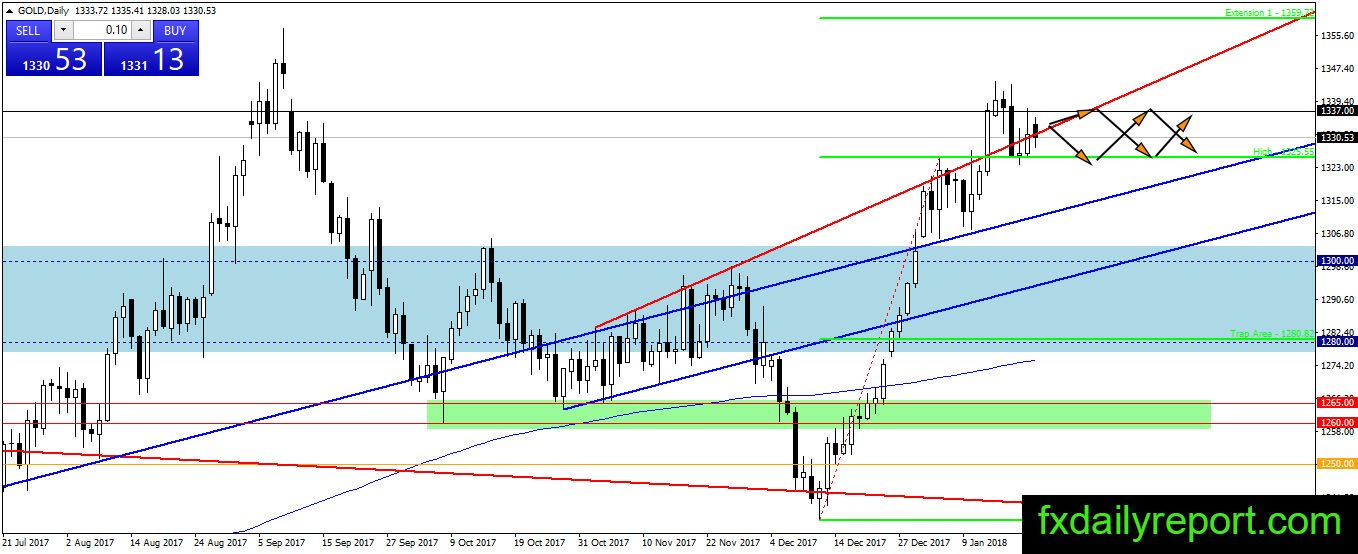
The situation on the gold daily chart shows the price test on $1,337 turned bearish as the price move down. If the price continues to move down, it will trade between $1,325 – $1,337 range we projected this week. We might see sideways movement until ECB rate announcement later on Thursday. The trend is bullish, and any pullback could be treated as a chance to enter at a lower price.

Today critical level to watch:
Support: $1,325, $1,320, $1,300, $1,280
Resistance: $1,337, $1,357, $1,360
Silver bearish continuation
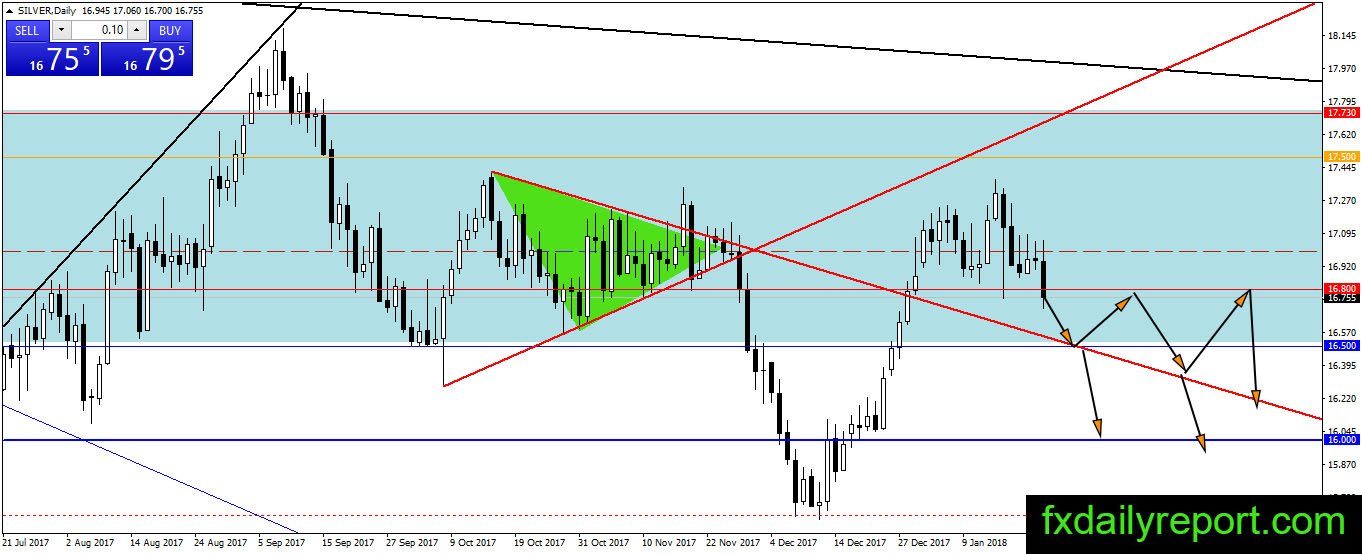
Despite the bullish advantage shown in silver price in the previous week, it looks like the bull losing the battle against the bear. Silver slide sharply below $16.80 today after consecutive failures to close above $17.00. The downward movement also surpassed previous week low and opened the possibility to reach $16.50.
Traders will observe today close to determine if the breakout is genuine or not.
Today critical level to watch:
Support: $16.80, $16.50
Resistance: $17.00, $17.50, $17.73, $18.00, $18.50.
Crude oil ranging between $$62.80 – $65.00
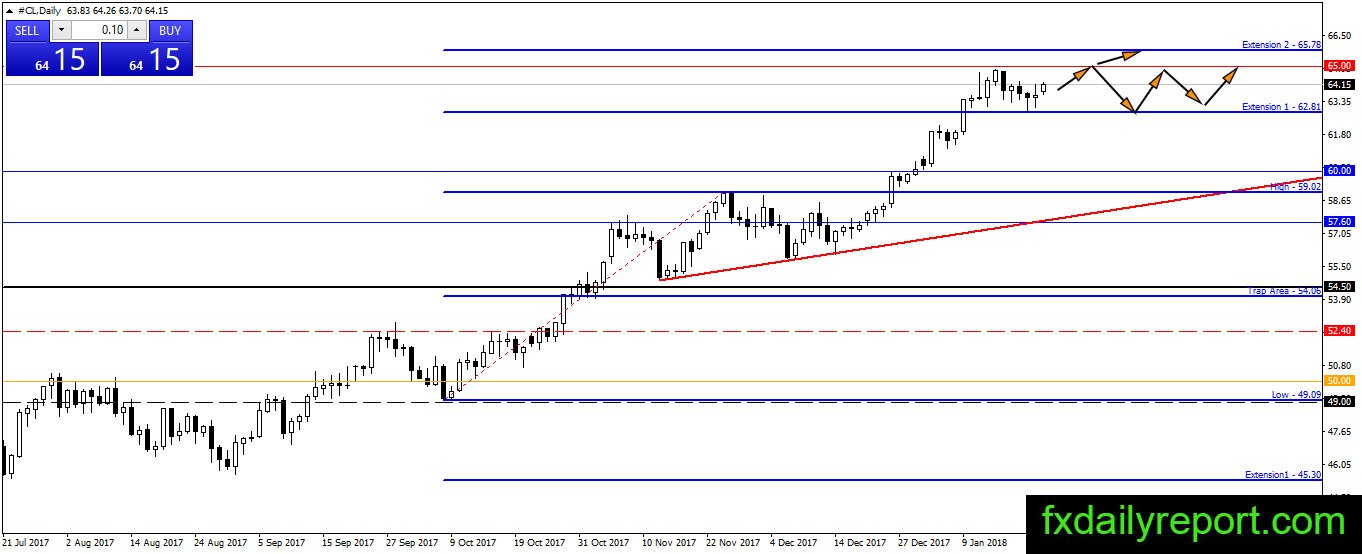
Crude oil continues its movement inside $62.80 – $65.00 after the bounce from $62.80. There is nothing to analyze yet until breakout happens. Meanwhile, traders could continue to trade the range.
Today critical level to watch:
Support: $62.80, $62.50, $60.00, $57.60
Resistance: $65.00