
Gold leaving the major area

Stalled at $1,200 – $1,220 area, the bear did not wait to sell the precious metal. Gold closed lower outside of the projected range after it reached the resistance area. Three bearish candlesticks might also known as three black crows pattern formed on the daily chart, and this strong bearish reversal pattern will be triggered if the price moves lower than $1,184.
Traders in China is out on Chinese new year celebration which might cause low activity in the gold price.

Today critical level to watch:
Support: $1,184, $1,180, $1,166, $1,160, $1,150
Resistance: $1,200, $1,220, $1,250
Silver tilted to new bearish leg
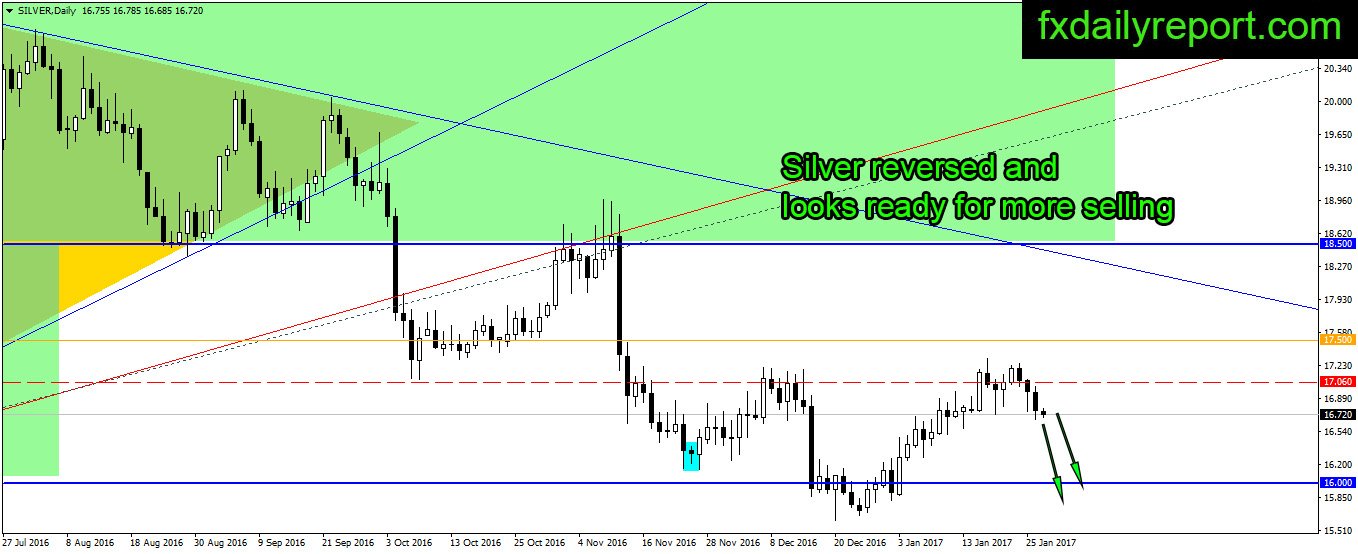
U.S dollar index strength put most major pairs and also commodities under pressure. Silver being sold below $17.50 and looks ready to move further downward. Without any support level seen, it looks like the price will move toward the $16.00 support level.
Today critical level to watch:
Support: $16.75, $16.50, $16.40, $16.15, $16.00
Resistance: $17.00, $17.20, $17.50, 18,50
Crude Oil waiting for trigger
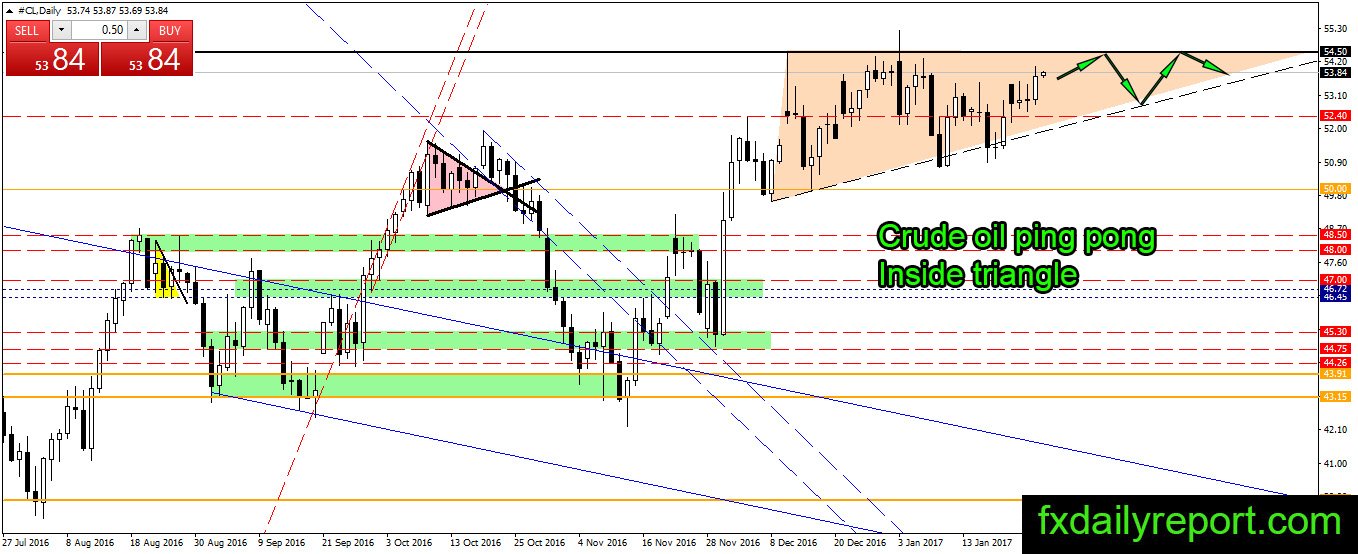
Despite the increase in crude oil inventory, the price of crude oil continues moving up inside the triangle range. The price might not move up much today as the week come to an end, but traders can expect more upside in the future.
Today critical level to watch:
Support: $52.40, $51.93, $50.50, $50.00, $49.60
Resistance: $54.50, $55.00