
Gold getting near the resistance

The weakness in U.S dollar used by the gold bull to push the price up. Currently, it is moving near the $1,200 – $1,220 resistance level. Non-farm employment data today might drive the price up toward it, or if the number is good, then the price might reverse down.
Today critical level to watch:

Support: $1,166, $1,160, $1,150, $1,144, $1,133, $1,127
Resistance: $1,180, $1,200, $1,220
Silver initial sign of reversal?
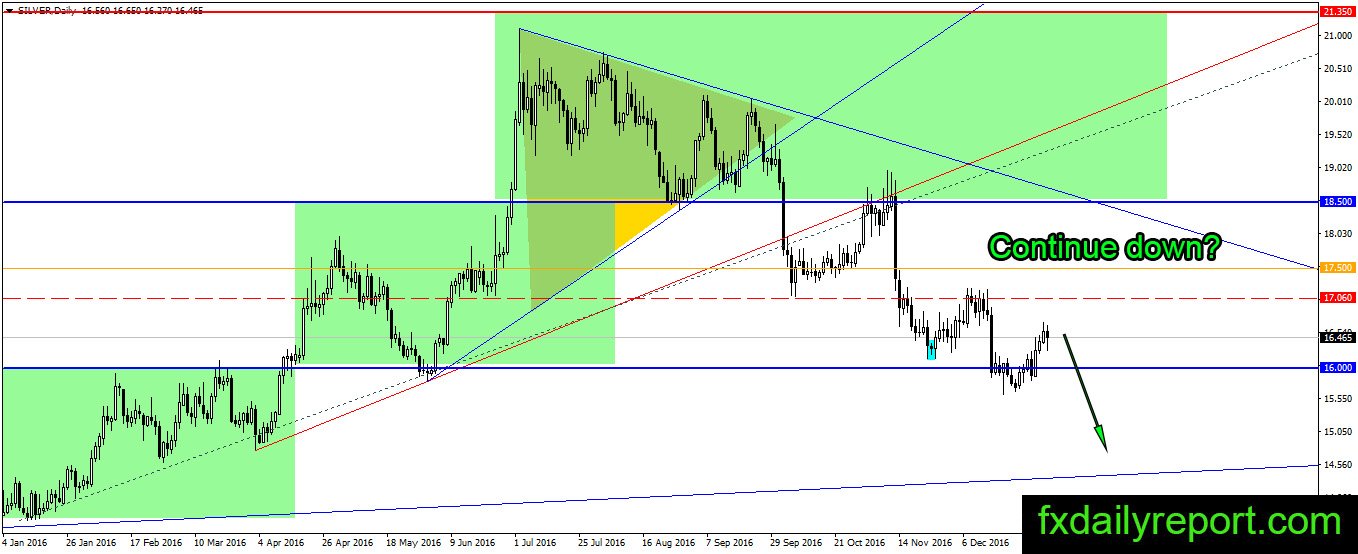
The price of silver experience sudden sell-off in today trading session, this might be profit taking or the reaction before job news today. Opposite to gold which looks to challenge the resistance, silver looks to close lower.
Today critical level to watch:
Support: $16.40, $16.15, $16.00, $15.80, $15.50
Resistance: $16.50, $16.75, $17.00
Crude Oil bear deflected

The deficit in U.S crude oil inventory did not move the price much, crude oil price still trapped inside the long bearish candlestick. This long bearish candlestick is a trend bar, and current upward movement can be regarded as consolidation movement only.
The key toward next movement is the breakout above the big trend bar, or either a close lower than $52.40.
Today critical level to watch:
Support: $52.40, $51.93, $50.50, $50.00, $49.60
Resistance: $54.50, $55.00