
Gold stick above $1,390
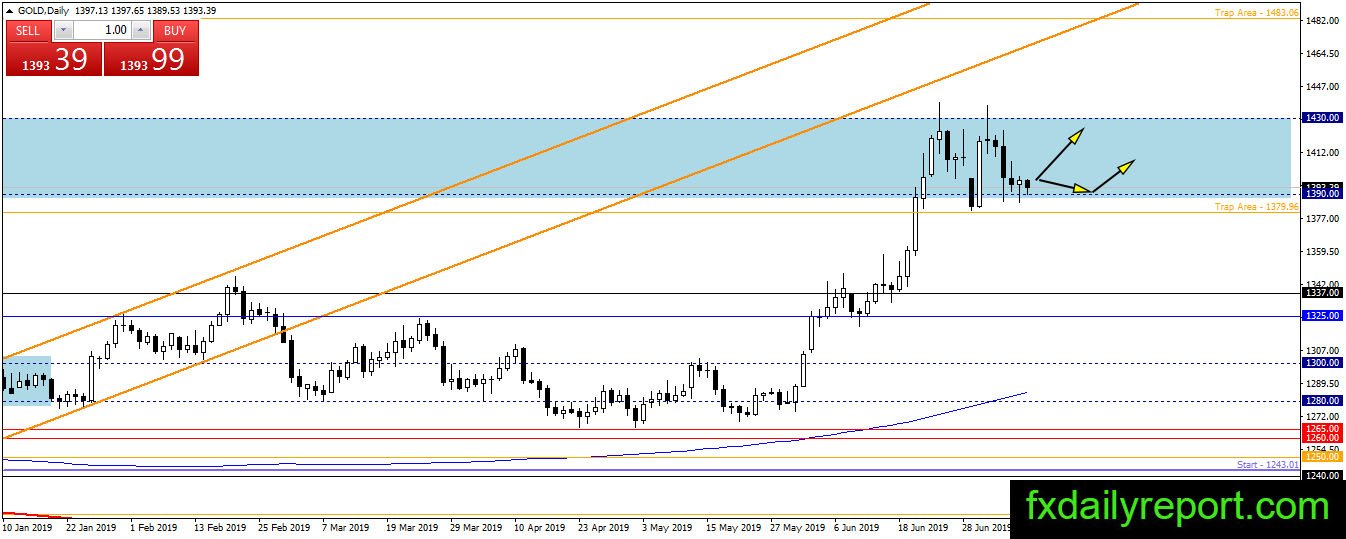
The test on $1,390 support level resulted in no breakout. The bull still maintains the level and there is no change to the current outlook. Gold expected to continue its ranging movement between $1,390 – $1,430 until breakout happen. Currently, traders could look for long positions near the bottom of the range with a tight stop below $1,380.

Today critical levels to watch:
Support: $1,390, $1,380
Resistance: $1,400, $1,430, $1,450, $1,500
Silver bounce from $15.00
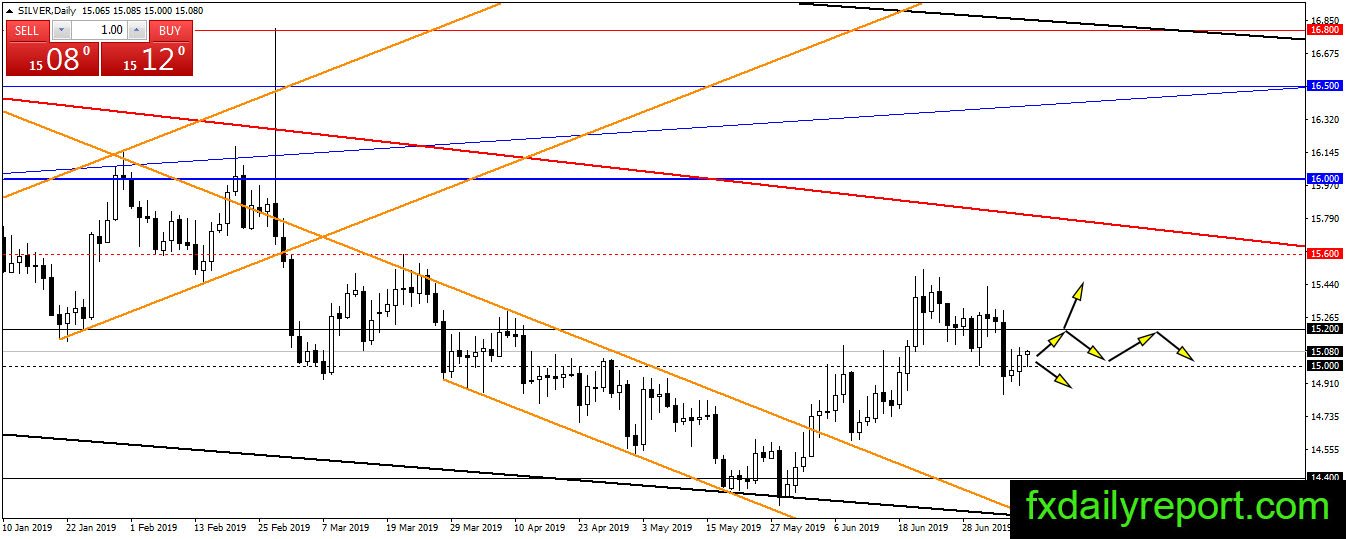
A close above $15.00 happened in the previous trading day. Silver launched upward but no close above Monday high yet. Today, the price corrected lower to test $15.00 support again. We have another bounce from the support level. Will silver continue upward and test $15.20?
Today Critical levels to watch:
Support: $15.00, $14.80
Resistance: $15.20, $15.60
Crude oil further bullish confirmation
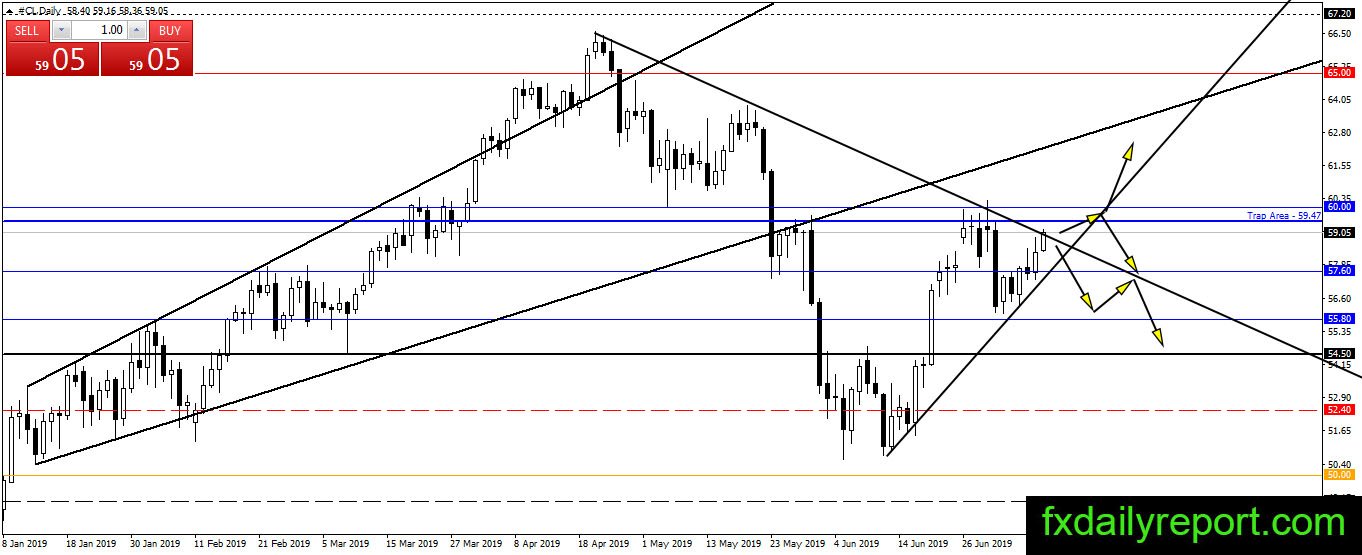
The bearish pin bar on crude oil chart not confirmed to the downside. Instead, the price bounced from $57.60 and closed higher. Today, the price continues its upward movement and getting near $60.00 resistance level. Traders might want to monitor possible triangle pattern on the crude oil chart. If the price could breakout above the top trendline and $60.00 then we will see a bullish continuation in crude oil prices.
Today critical level to watch:
Support: $57.60, $55.80, $55.00, $54.50
Resistance: $60.00