
Gold new all-time high
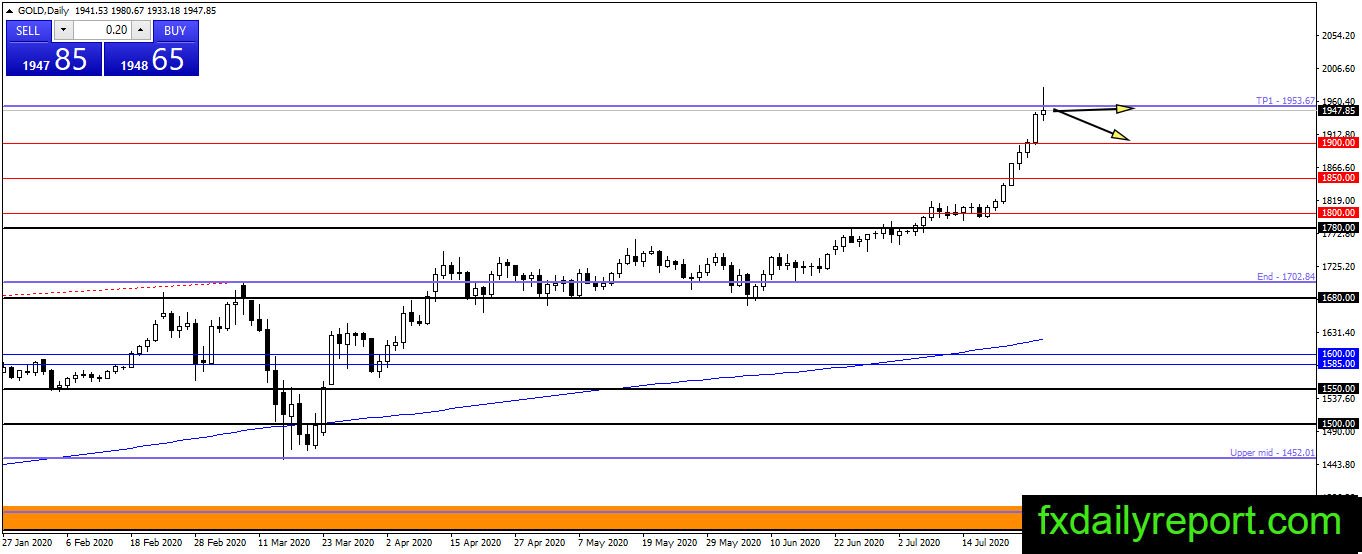
A new all-time high printed in the gold chart. The price surpassed $1,919 or 2011 high and currently trading at $1,943. We might have a bearish reaction from the $1,950 level and gold might close as bearish pin bar pattern. However, there is no confirmation yet at the current time.

Traders will wait for the closing level at the end of the day to determine gold next direction.
Today critical levels to watch:
Support: $1,919.90, $1,900, $1,850
Resistance: $1,950
Silver reached $25.00 – $26.00
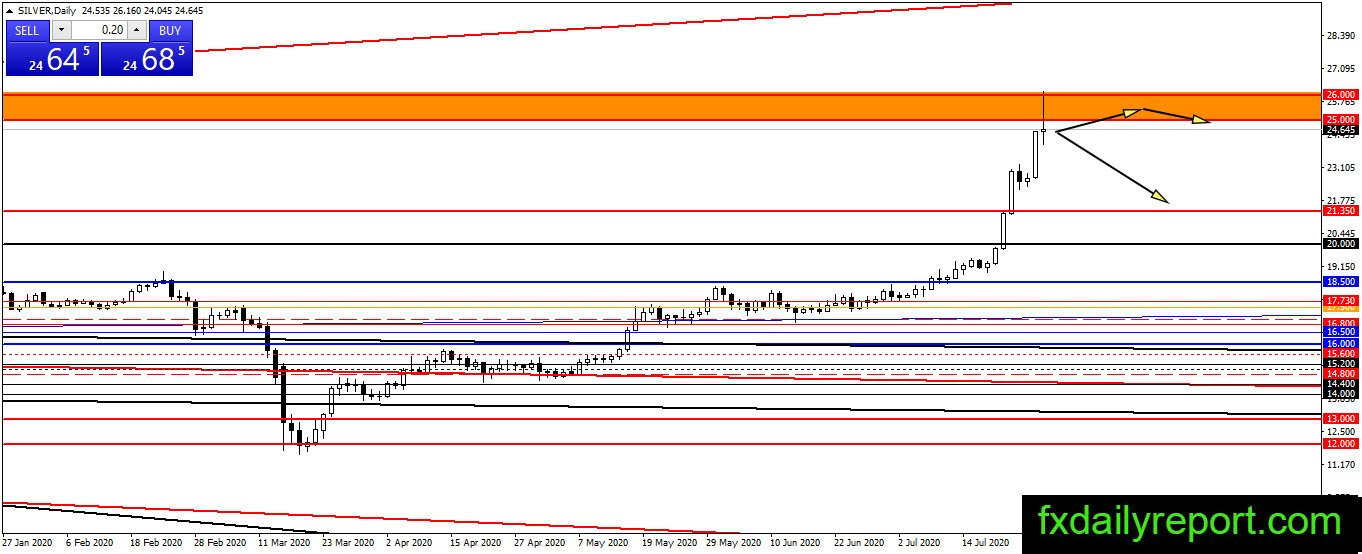
The jump in Silver prices lead the precious metal higher and reach the $25.00 – $26.00 target today. There is a bearish reaction from the resistance area however traders will need for closing level before determining the next direction.
If silver starts moving lower then traders could consider entering long positions near $21.35.
Today Critical levels to watch:
Support: $21.35, $20.00, $18.50
Resistance: $25.00, $26.00
Crude oil mostly sideway
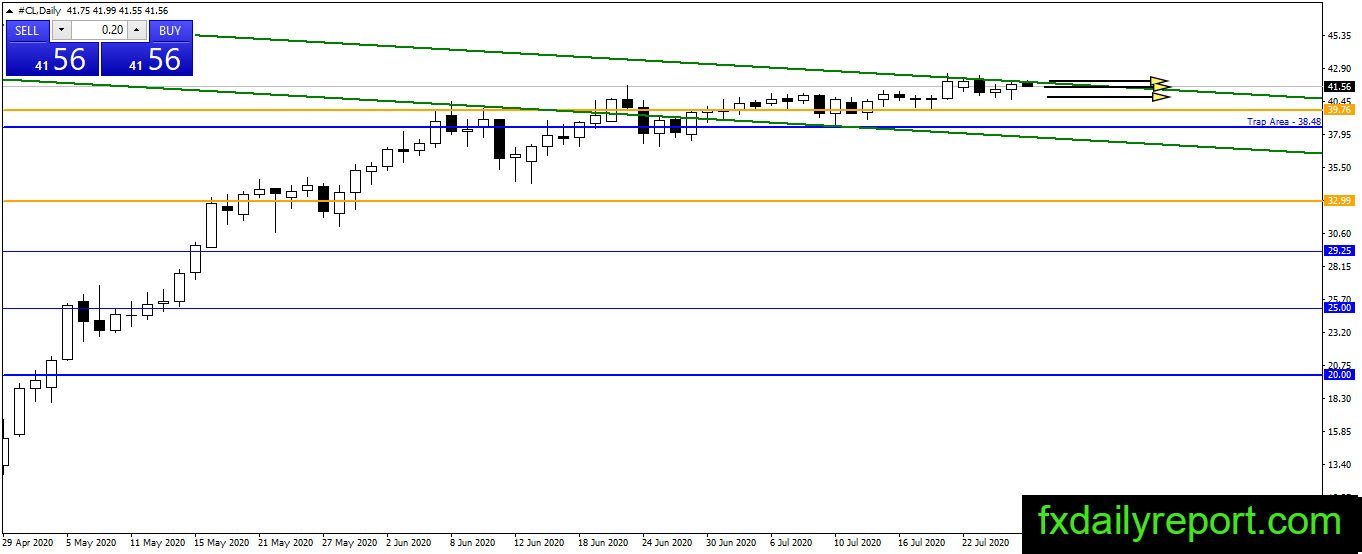
Crude oil prices little changed despite the major bullish pressure against U.S dollar. The price of crude oil might continue its sideways movement near the current level. No change to the outlook yet, as long as the price maintains the level above $38.50 then there is a chance for further upside in the price.
Today critical level to watch:
Support: $40.00, $38.50
Resistance: $49.00, $50.00