
Gold ascending triangle pattern
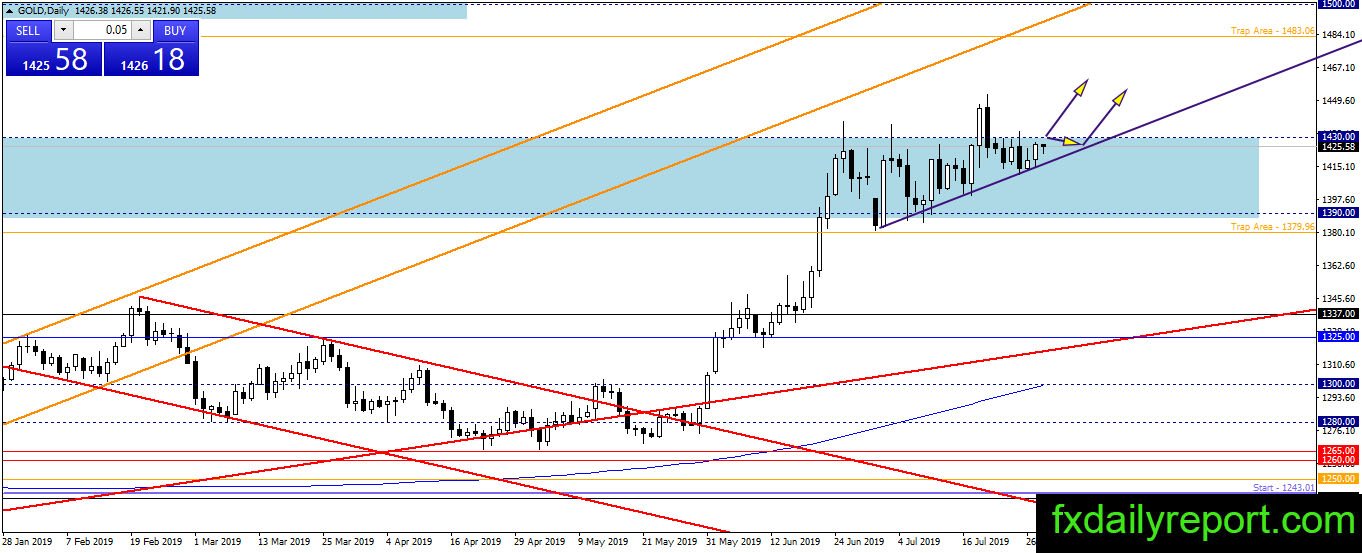
Gold formed an ascending triangle pattern with $1,430 as the top. The precious metal might continue its consolidation inside the pattern until this week the Fed interest-rate decision. Depend on the result of the rate decision, gold could move anywhere even though the current prevailing pattern is bullish.

Today critical levels to watch:
Support: $1,400, $1,390, $1,380
Resistance: $1,430, $1,450, $1,500
Silver aiming to break above $16.50
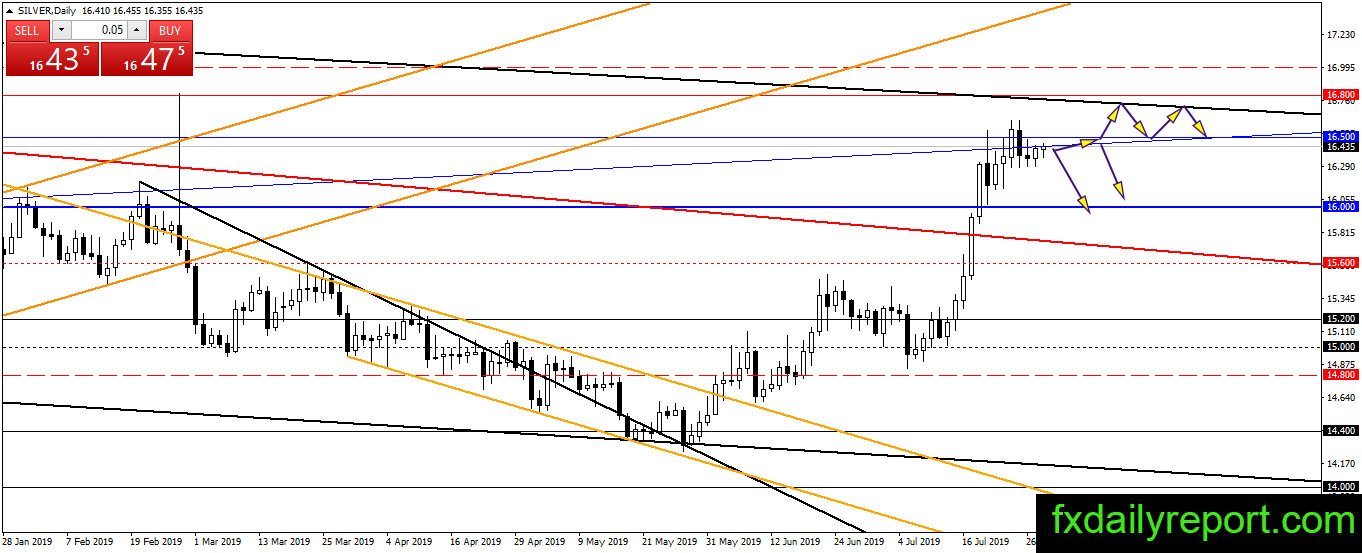
The overall trend of silver is bullish and stick at the level near $16.50. No reaction from the resistance yet before the Fed interest-rate decision. After the interest-rate decision, we might see the silver price either breakout above the resistance or rejection from the resistance and correction toward $16.00.
Today Critical levels to watch:
Support: $16.00, $15.60, $15.20
Resistance: $16.50, $16.80
Crude oil sideway inside $55.80 – $57.60
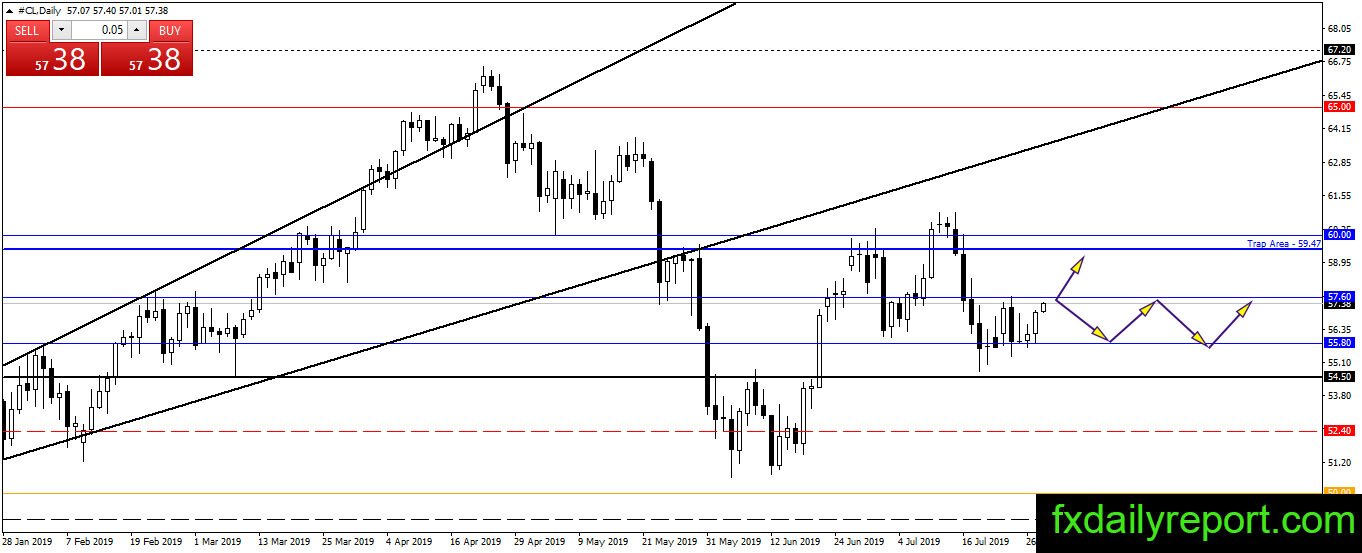
Crude oil bounced from $55.80 yesterday and moving near $57.60 once again. The price moving as expected, ranging inside the $55.80 – $57.60 area. At the current time, traders could continue to apply the ranging strategies and scale-out of positions before the Fed FOMC meeting.
Today critical level to watch:
Support: $55.80, $55.00, $54.50
Resistance: $57.60, $60.00, $65.00