
Gold breakout time?
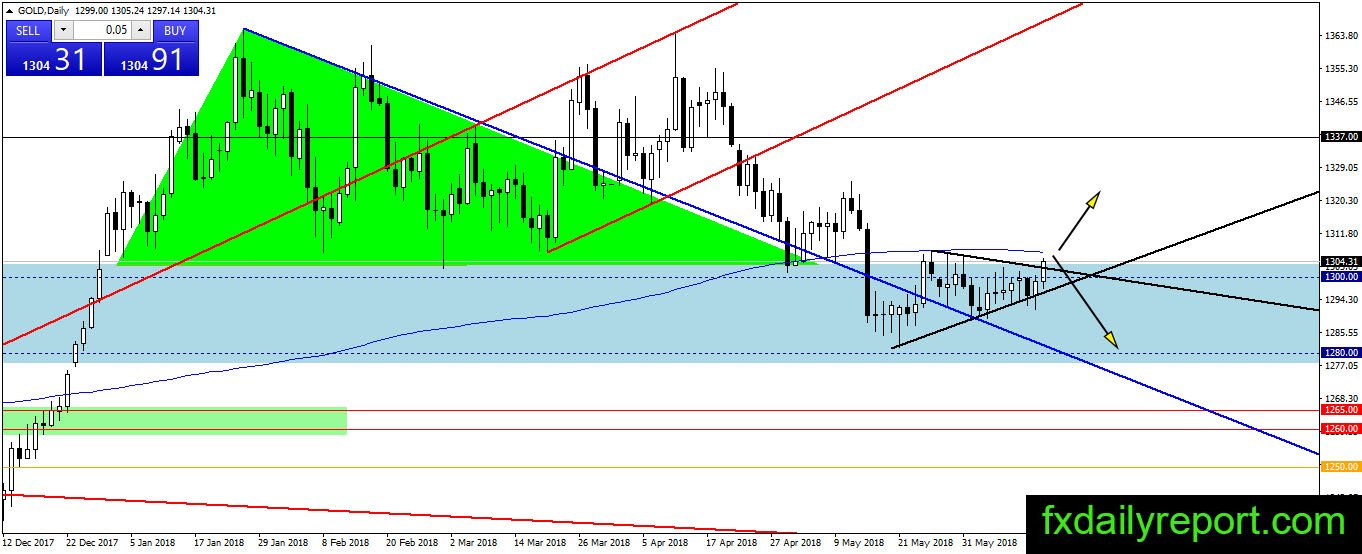
Gold price inch higher in today trading, moving above the top of triangle consolidation. The precious metal will reach daily SMA 200 soon. Is it a genuine breakout? We could not confirm it yet until the close of the daily candlestick. Aside from the bullish outlook, there is flip level resistance present at current daily SMA 200 level as well. It is better for traders to wait until the market show their hand before placing positions.

Today critical level to watch:
Support: $1,300, $1,280
Resistance: $1,320, $1,325
Silver on the verge of testing red trendline
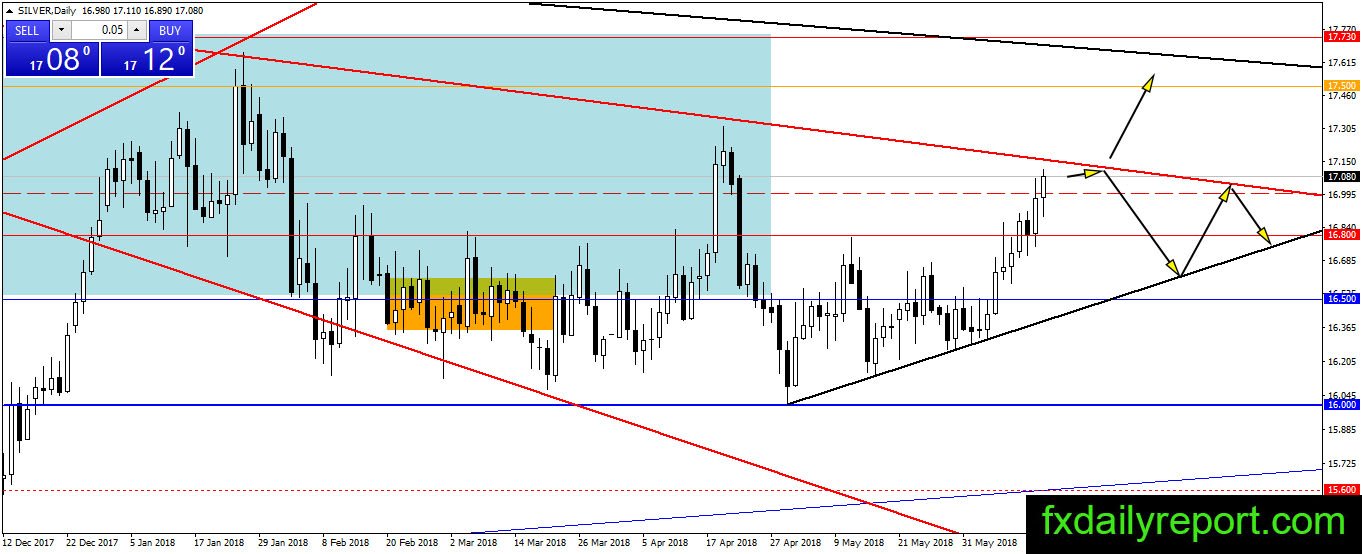
The upward momentum has not slowed yet as silver surpass $17.00 today. It is possible for the bull to press the price higher above the red trendline. However, traders must proceed with caution and never buy near the resistance. Wait until the close above the red trendline, followed by a successful retest.
Today critical level to watch:
Support: $17.00, $16.80, $16.50, $16.00
Resistance: Red trendline
Crude oil ready for a bounce
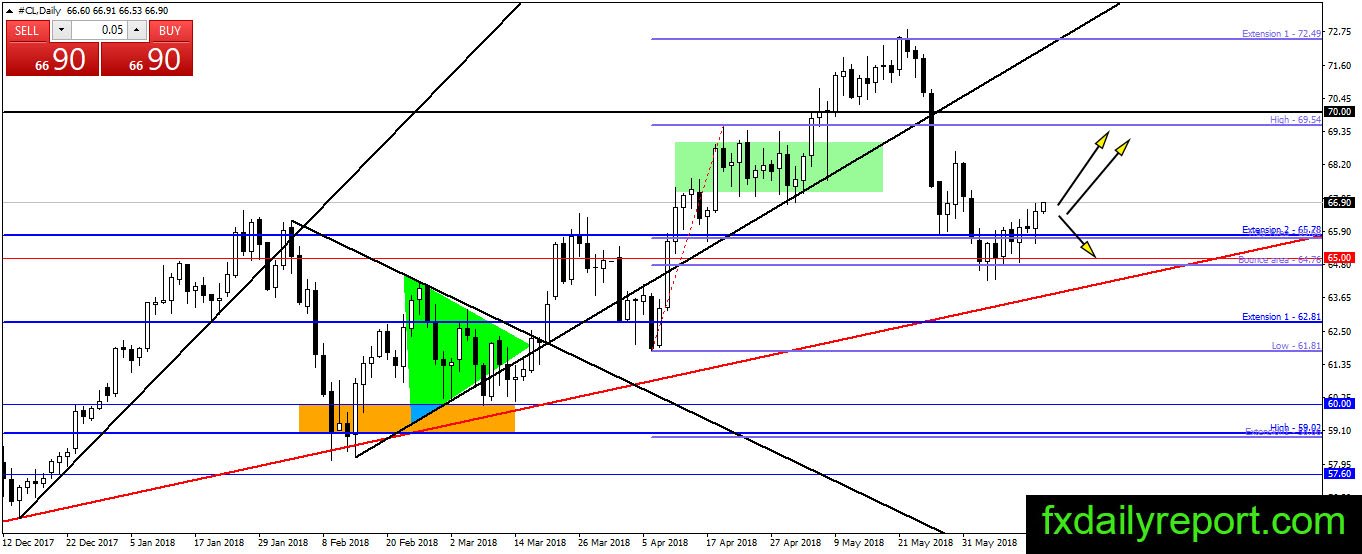
Crude oil formed a bullish candlestick in the previous day close. Although the candlestick did not surpass Tuesday candle high, it confirmed short-term bullish outlook. At the current time, the bull needs to clear green box area and the high around $68.50 to secure bullish path toward $70.00.
Today critical level to watch:
Support: $66.00, $65.78, $65.00, $62.80
Resistance: $70.00