
Gold bullish reaction
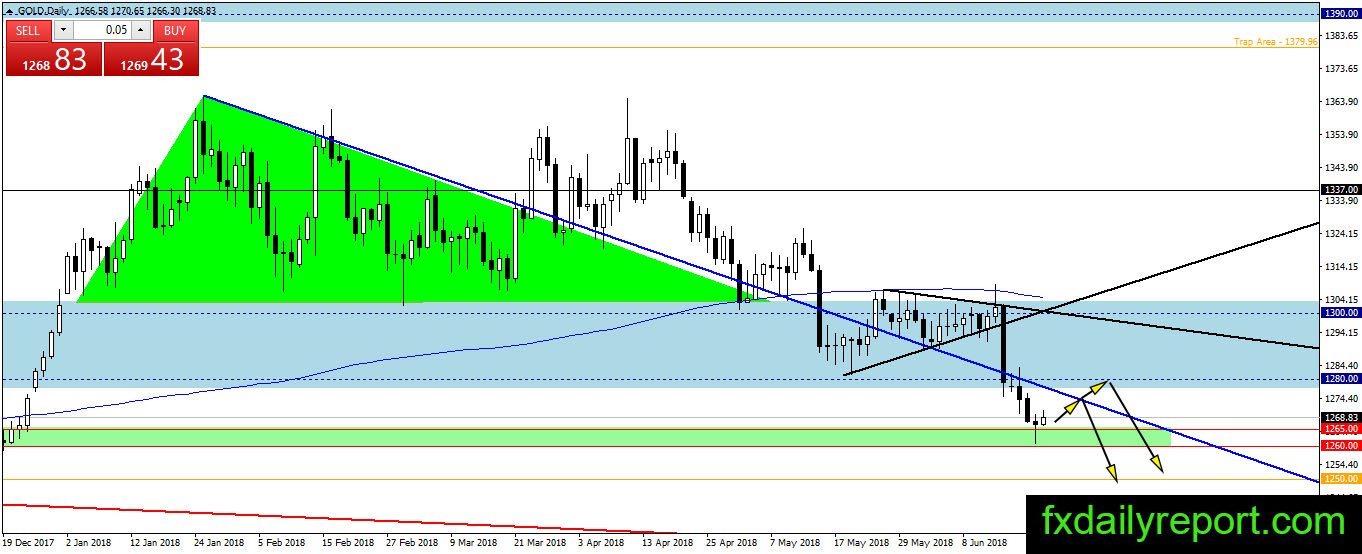
The bullish reaction is shown by gold after the test of green box area between $1,2360 – $1,265. The bullish reaction formed a bullish pin bar pattern and the top being tested today. If the bull manages to close the price above the high, then gold has a chance to move further higher toward $1,280.

When the price hit $1,280 or the blue trendline, traders could place short position.
Today critical level to watch:
Support: $1,260, $1,250
Resistance: $1,265, $1,280
Silver regain part of losses, ready to test $16.50
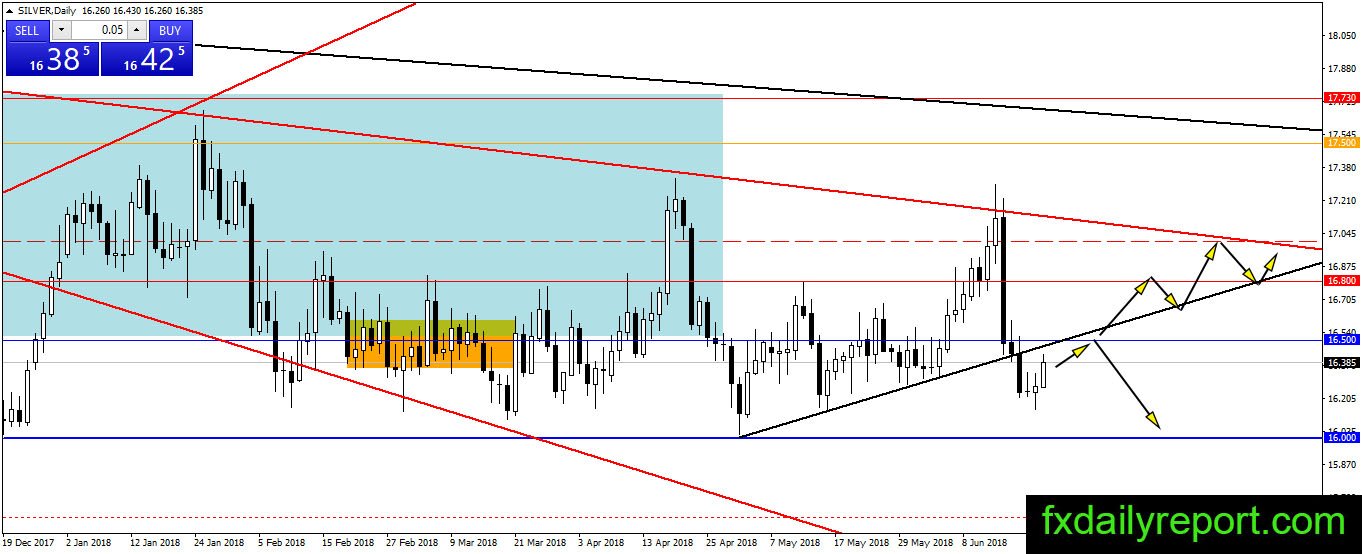
After the breakout below the black trendline, silver entered a new bearish trend. At the current time, the price regains part of its losses this week and ready to test $16.50 broken level. We expect the bearish trend will continue and $16.50 level holding out against the buying pressure.
Today critical level to watch:
Support: $16.00
Resistance: $16.50, $16.80, $17.00
Crude oil waiting for OPEC result
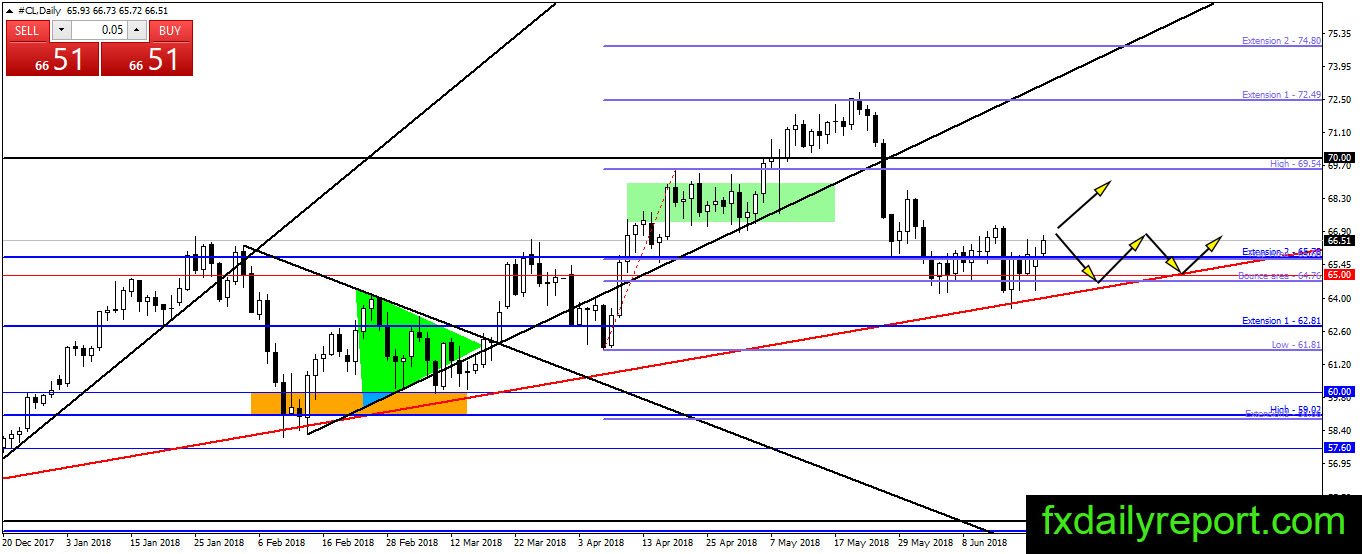
OPEC set to announce a new deal or no deal on the oil production. The market expects the cartel will push the production cap to slow down the oil price appreciation. Depend on the meeting, and oil might tumble from the current level and test the red trendline again. On the bullish side, it is also possible the price closed above $67.08 to start a new bullish leg.
Today critical level to watch:
Support: $66.00, $65.00, $62.80
Resistance: $70.00