
Gold correction before bullish continuation?
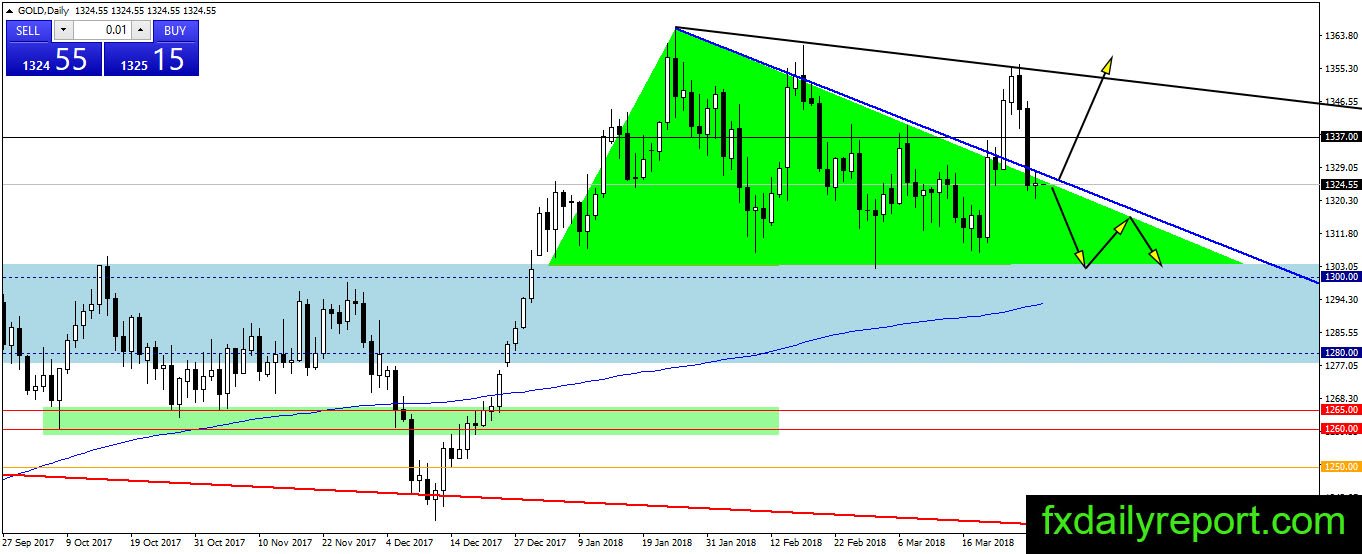
Gold made a decisive breakout in the previous week and followed through by the bull. The upward price movement hit the trendline shown on the chart before it reversed down. Currently, the precious metal prices hover near the breakout point and looking for bullish continuation pattern.

Traders could look for a long position with a stop below the momentum candle $1,309.
Today critical level to watch:
Support: $1,325
Resistance: $1,337, $1,340, $1,350, $1,360
Silver triangle respected
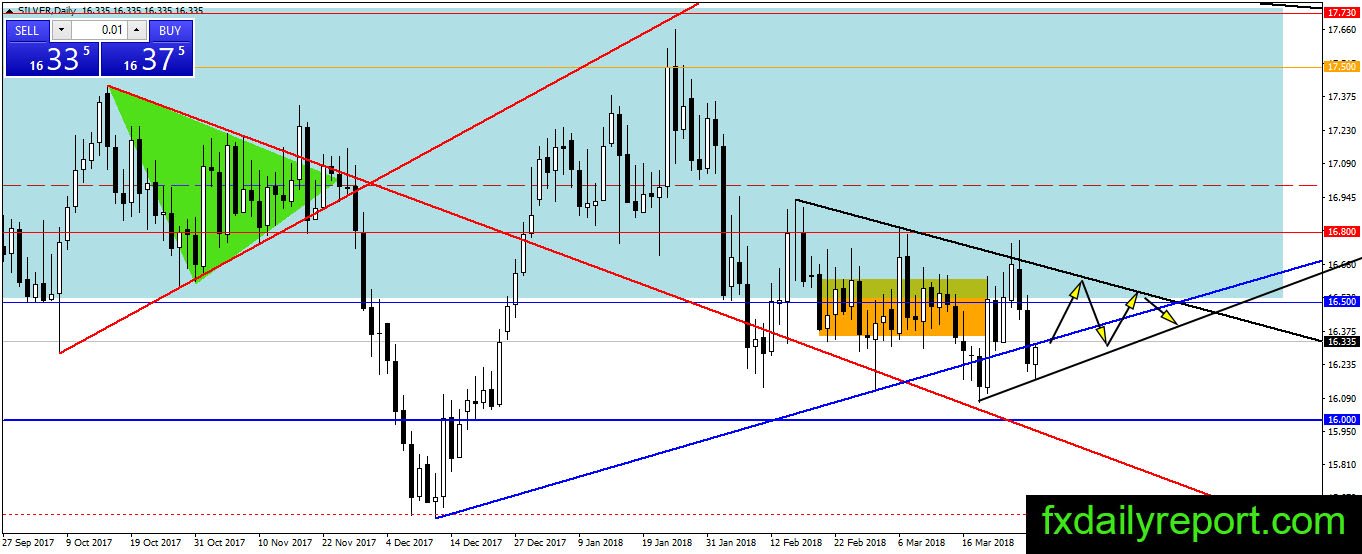
Silver moved sluggishly this week and moved down after it hit the top of the triangle pattern. There is no direction settled yet for silver, and the precious metal should continue its consolidation. We expect silver to continue its sideways movement inside the triangle with little extension downside.
Today critical level to watch:
Support: $16.30, $16.00
Resistance: $16.50, $16.80
Crude oil withstanding selling pressure
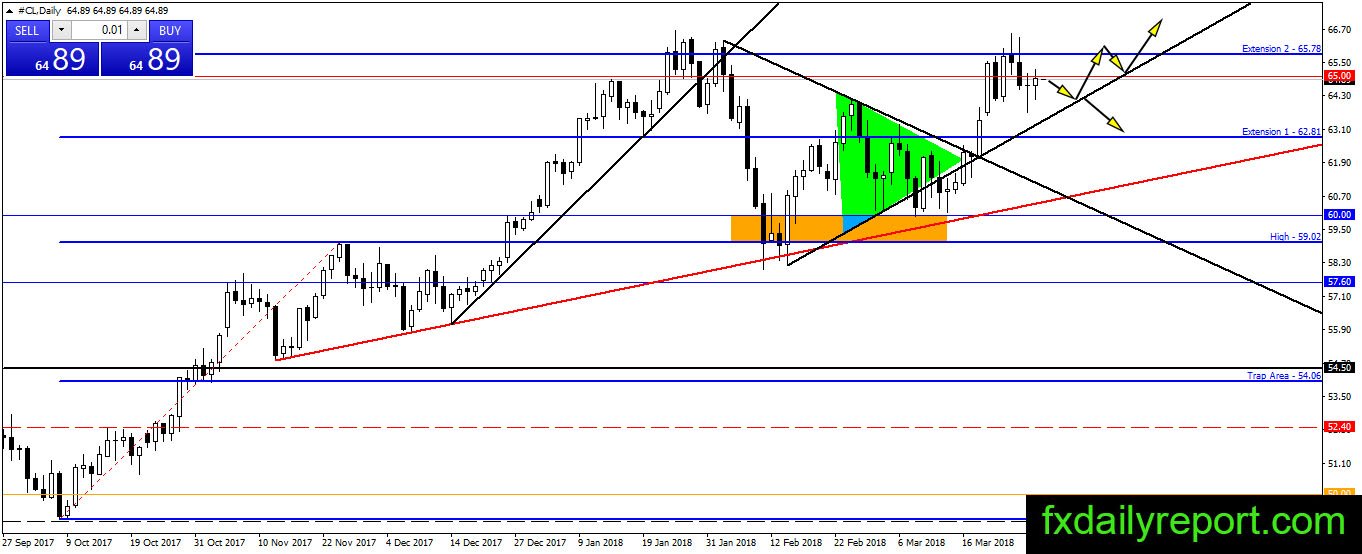
Crude oil experienced mini selling this week as the U.S crude oil inventory ticked up 1.6 million barrels vs. an increase of 0.5 million barrels expectation. The selling pressure immediately recedes and the bull maintains the price near $65.00. The direction continue pointed upward, and traders might want to avoid short position for now until further bearish evidence appear.
Today critical level to watch:
Support: $62.80, $62.50, $60.00, $59.00
Resistance: $65.00, $65.78