
Gold harami pattern

Harami pattern when the price moved down regarded as a bullish pattern, but the bearish candlestick formed on the second day cannot be overlooked. The price might continue its downward movement toward $1,200 – $1,220 area. On the other hand, a close above $1,237 will end correction phase and put gold on the bullish track.
Today critical level to watch:

Support: $1,220, $1,200, $1,184
Resistance: $1,237, $1,244, $1,250, $1,280 – $1,300
Silver unable to close above trendline
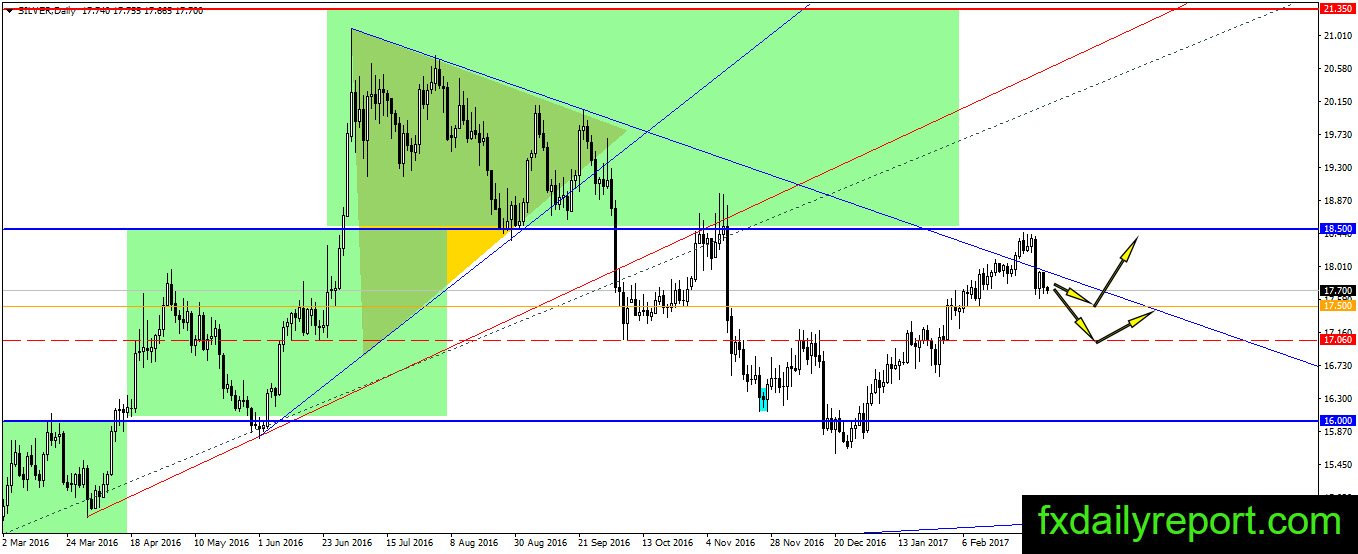
Bearish trendline in silver continue to limit the price below it. Even though the price recovered its losses on the first day after the price close below the trendline, it is unable to move higher. If the price move lower and close below Friday low $17.59, then correction might continue toward $17.00
Today critical level to watch:
Support: $17.50, $17.20, $17.00, $16.75
Resistance: $18.00, $18.50, $18.90, $19.00
Crude oil same story
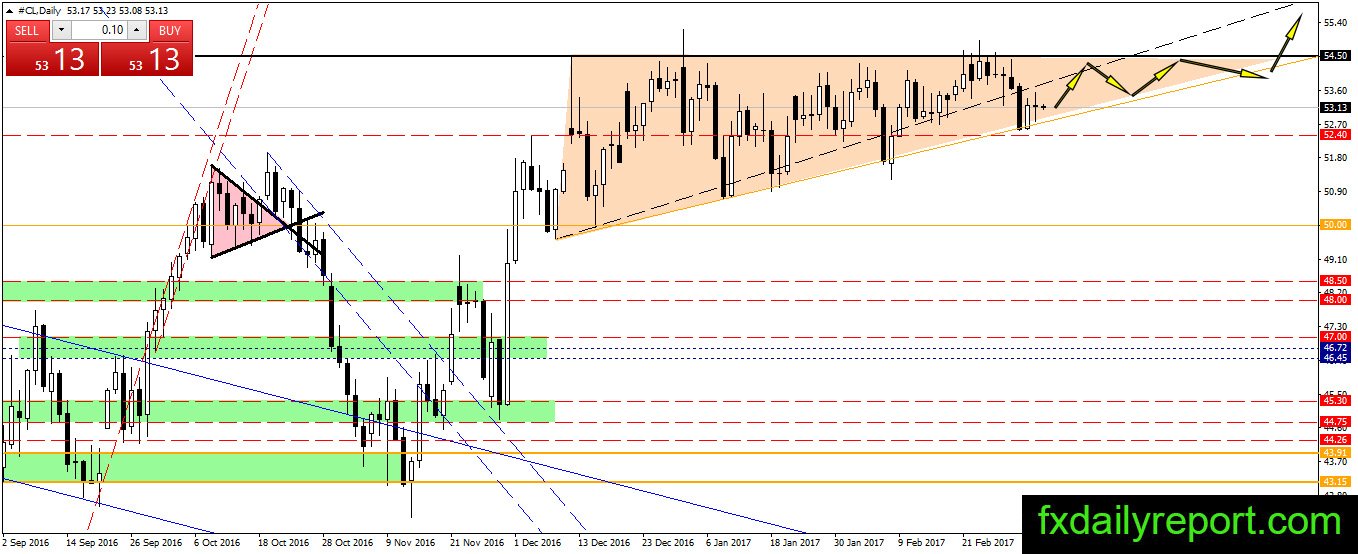
Spinning top pattern formed on Yesterday trading session. Crude oil continues its sideway movement inside triangle range. The price made another test toward the bottom of the triangle and bounced higher. Today, the price expected to continue its movement inside the triangle range.
Today critical level to watch:
Support: $52.40, $51.93, $50.50, $50.00, $49.60
Resistance: $54.50, $55.00