
Gold slide lower below harami pattern
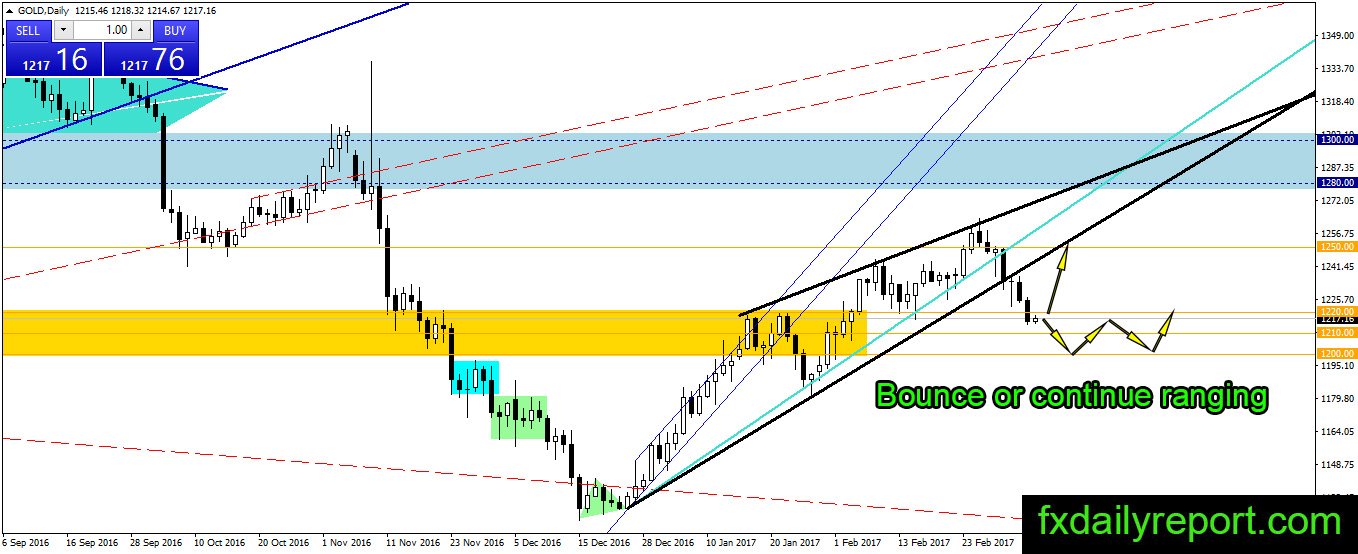
The slide in gold price brought it to $1,200 – $1,220 support area. The price will look for a bounce from this area, but if it broke lower than $1,200, traders might consider switching to a bearish view. Traders still waiting for major mover & shaker this week which is ECB meeting and Non-farm employment data.
Meanwhile, gold might move sideway between $1,200 – $1,220 range.

Today critical level to watch:
Support: $1,200, $1,184
Resistance: $1,220, $1,237, $1,244, $1,250, $1,280 – $1,300
Silver tumbled below $17.50
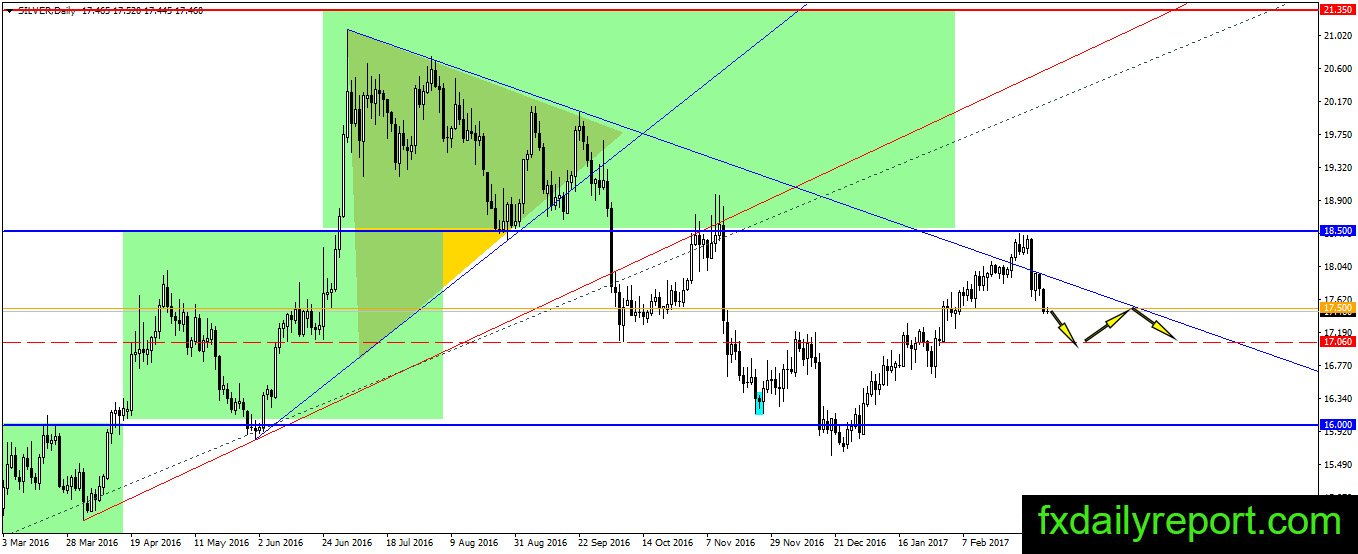
Silver slide lower Yesterday after it was unable to close above the bearish trend line. The price closed below $17.50 open way toward $17.00 where stronger support level present. If the price continues lower below $17.00, we might have a new bearish leg which will challenge $16.00 and further.
Today critical level to watch:
Support: $17.50, $17.20, $17.00, $16.75
Resistance: $18.00, $18.50, $18.90, $19.00
Crude oil failed bullish attempt
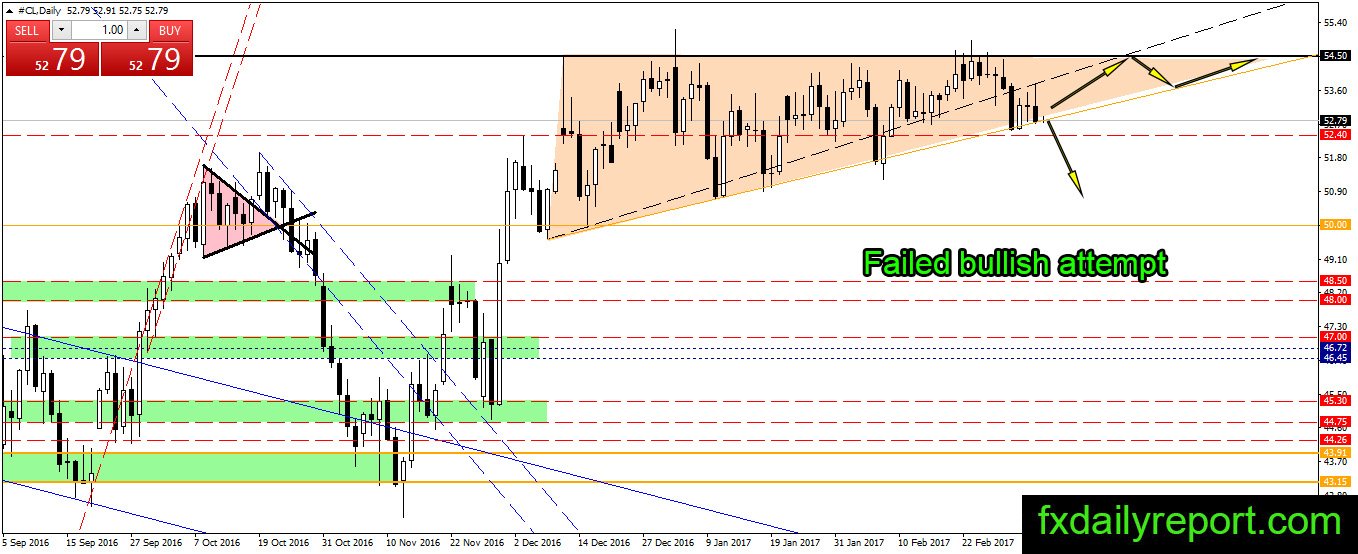
Crude oil made an attempt to move higher, but the price rejected when it move near dashed trendline. The failed attempt open opportunity for bearish scenario today if the price manages to move lower than $52.40. Otherwise, the price might continue its ranging movement inside triangle pattern.
Today critical level to watch:
Support: $52.40, $51.93, $50.50, $50.00, $49.60
Resistance: $54.50, $55.00