
Gold ascending triangle
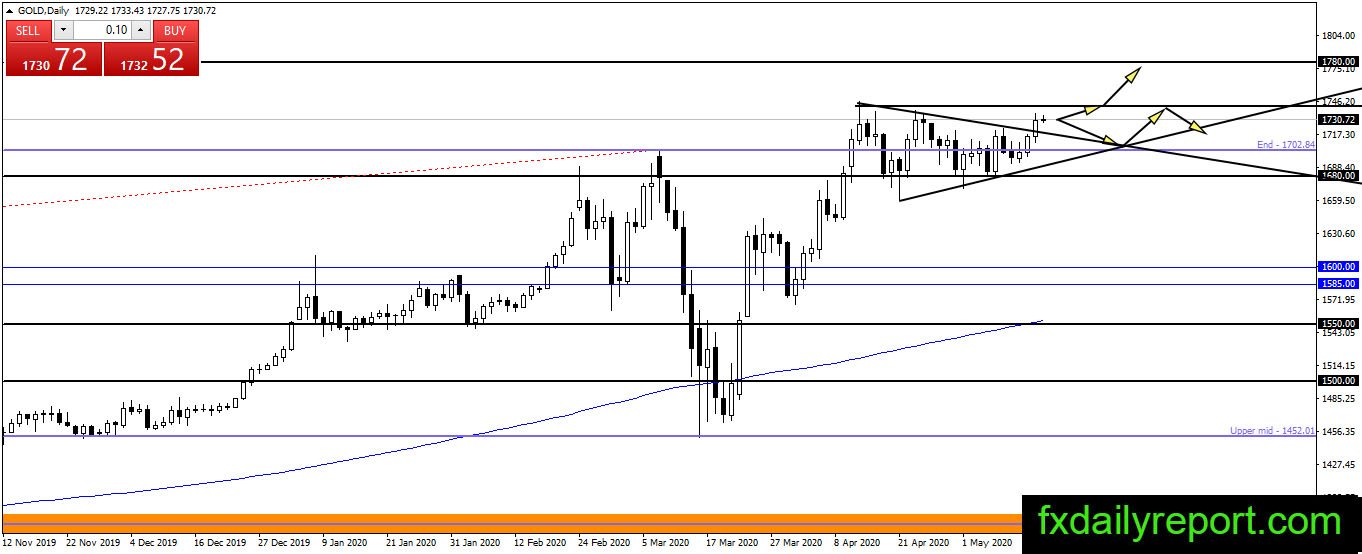
Gold breakout from the triangle pattern on its daily chart. However, the precious metal currently faces another triangle pattern which is the ascending triangle. It is a bullish pattern and has high odds for further bullish continuation. A breakout above the pattern high around $1,740 – $1,750 will trigger a further upside toward $1,780.

Today critical levels to watch:
Support: $1,700, $1,680, $1,650, $1,600
Resistance: $1,750, $1780
Silver bullish breakout above $15.60
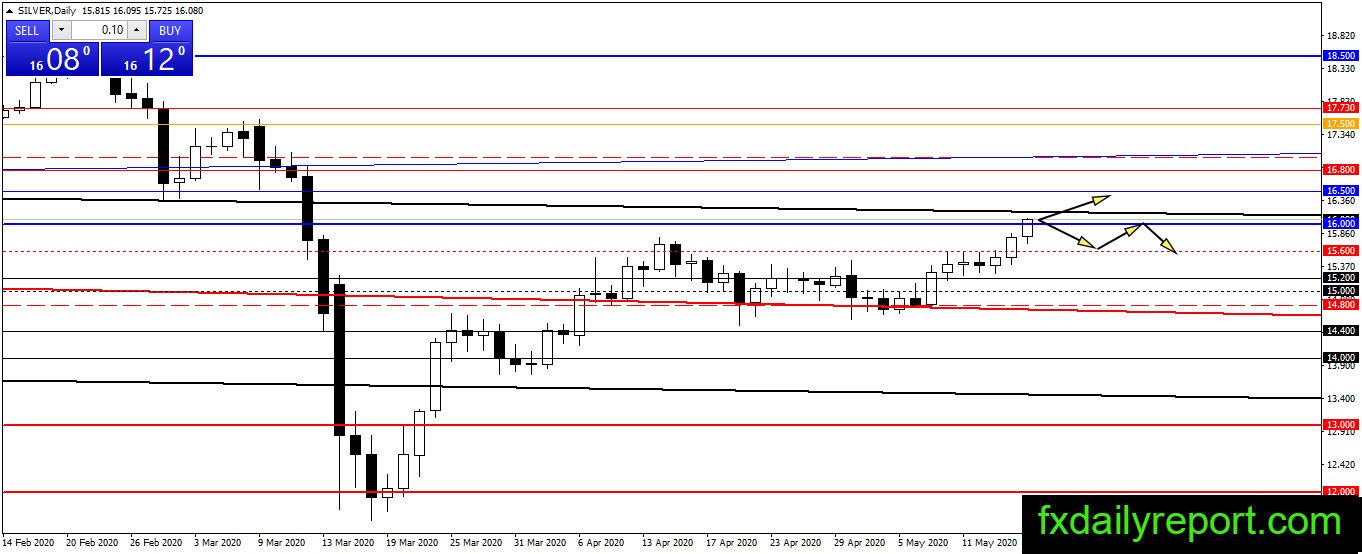
The bullish continuation happens in silver prices which climb above $15.60 resistance. At the current time, silver prices are testing the $16.00 resistance. Without major bearish reaction, we think silver will extend its upward movement and target $16.50 and $16.80.
Today Critical levels to watch:
Support: $15.60, $15.20, $15.00
Resistance: $16.00, $16.50, $16.80
Crude oil set to target $30.00 and higher
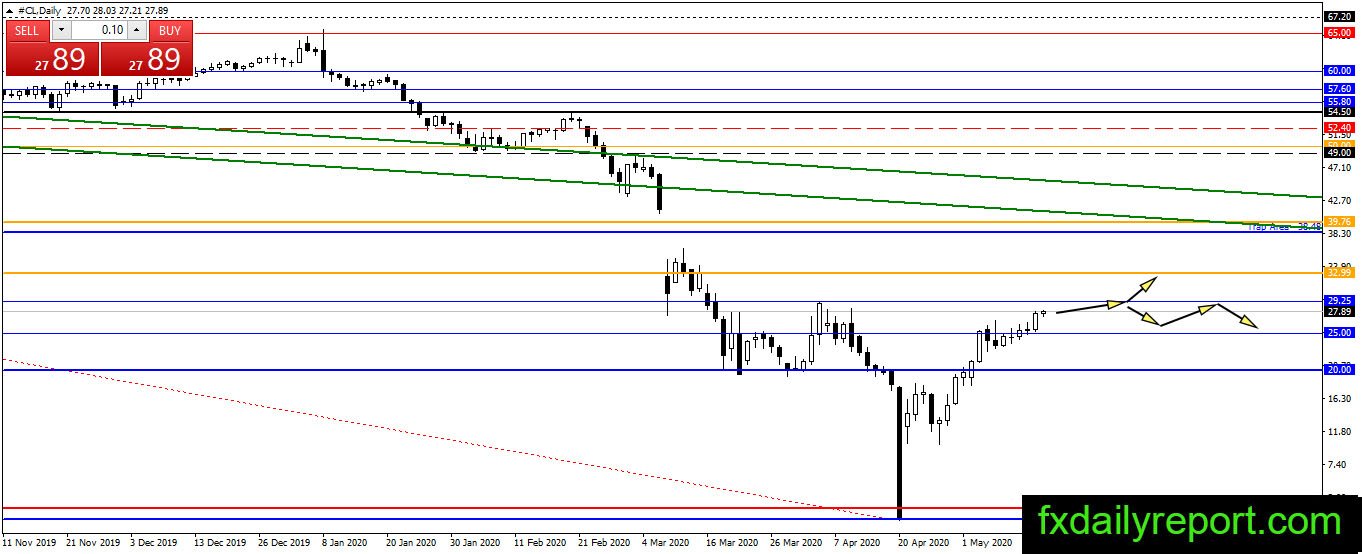
Crude oil extends its bullish pressure above $25.00 and currently not far from $30.00. OPEC production cut seems taking a positive effect on crude oil prices. If the price continue upward then it might close the gap around $40.00. At the current time, traders should avoid taking short positions until there is a major bearish reaction in crude oil prices.
Today critical level to watch:
Support: $25.00, $22.00, $20.00
Resistance: $30.00