
Gold continue ranging between $1,280 – $1,300
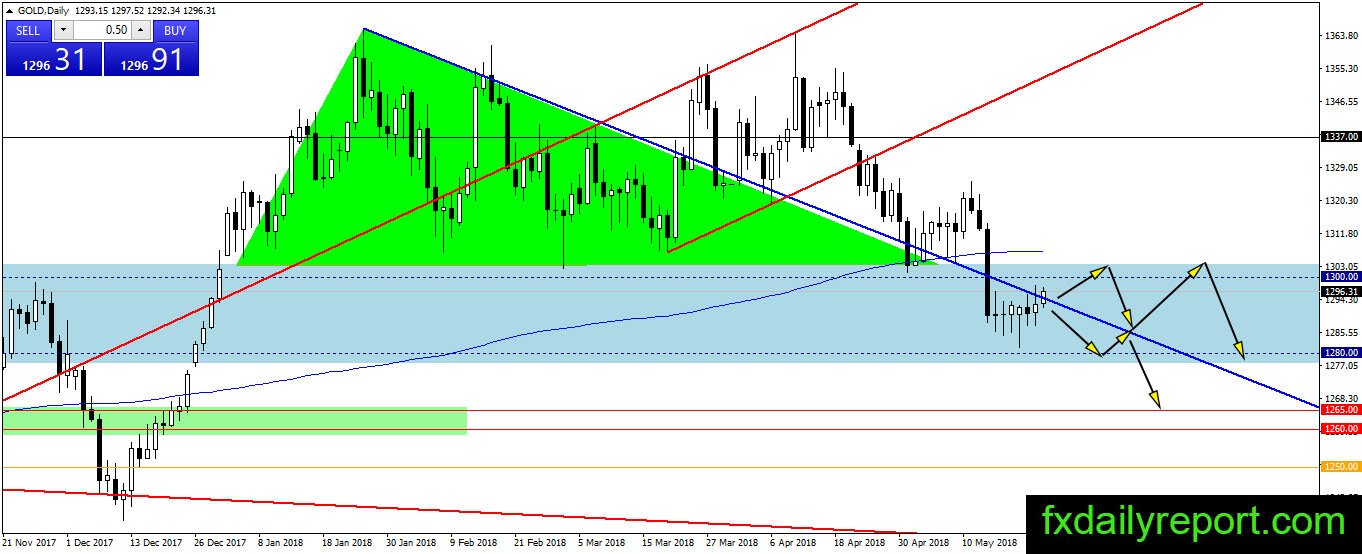
The price of gold traded below the blue trendline shown on the daily chart and expected to continue its movement near it. Currently, the price moves up and targeting the top of $1,280 – $1,300 range. There is no change to the current trend and gold might trade inside the range with a bearish bias.

Today critical level to watch:
Support: $1,280
Resistance: $1,300, $1,320, $1,325
Silver stay below $16.50
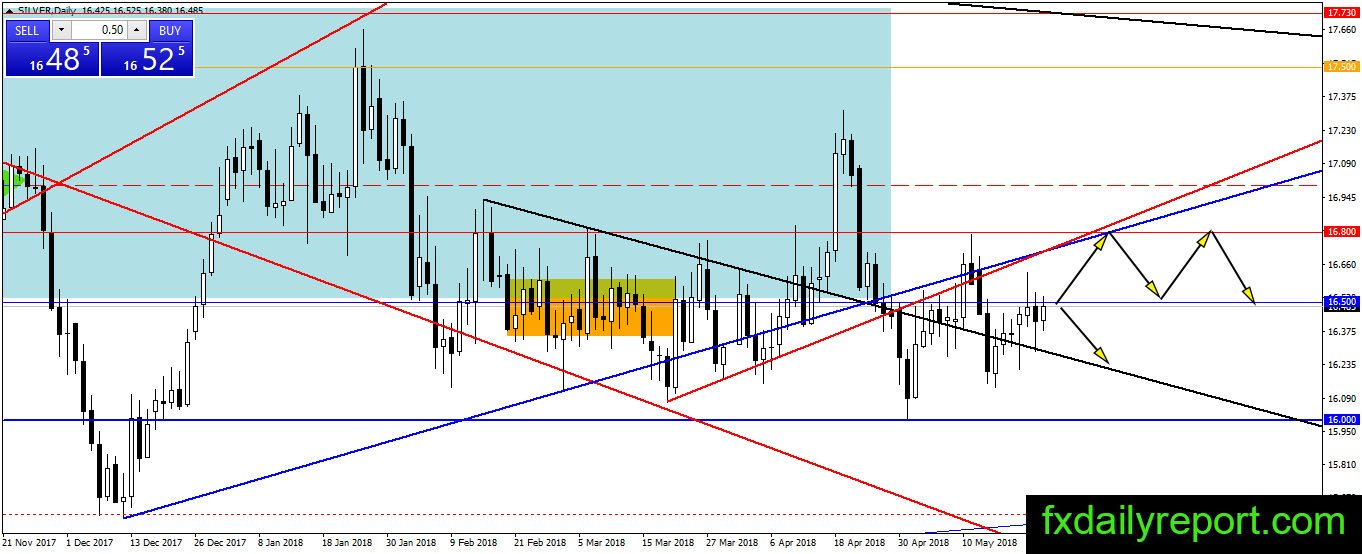
There is no strong bullish progress in silver yet, and the precious metal could not move above $16.50 resistance. If there is no breakout in this week, then we might see a bearish continuation in the silver price. The bearish pressure could break below $16.00.
Meanwhile, a close above $16.50 could trigger more buying toward $16.80 – $17.00 resistance.
Today critical level to watch:
Support: $16.00
Resistance: $16.50, $16.80, $17.00
Crude oil looks to test black trendline
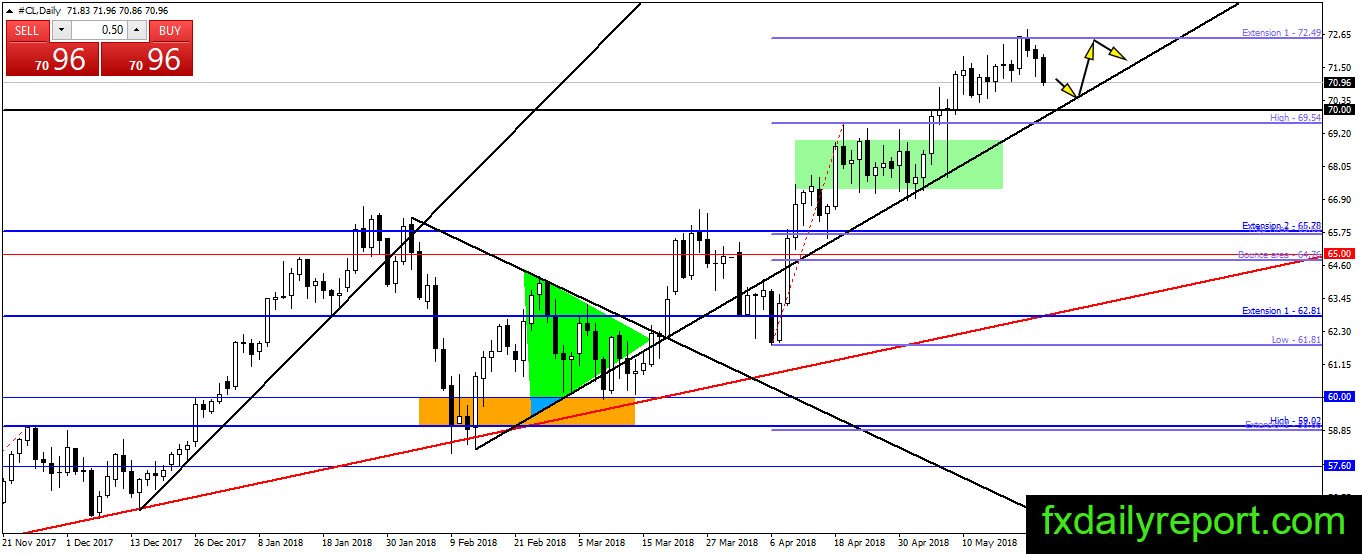
Crude oil weakens after it reaches first Fibonacci extension level. The price fall for the third day and ready to reach the black trend line. Traders could look for long position when the price reaches black trendline. Watching the lower level, $70.00 is the main target for a long position.
Today critical level to watch:
Support: $70.00, $65.78
Resistance: $72.49, $75.00