
Gold bounce from daily SMA 200
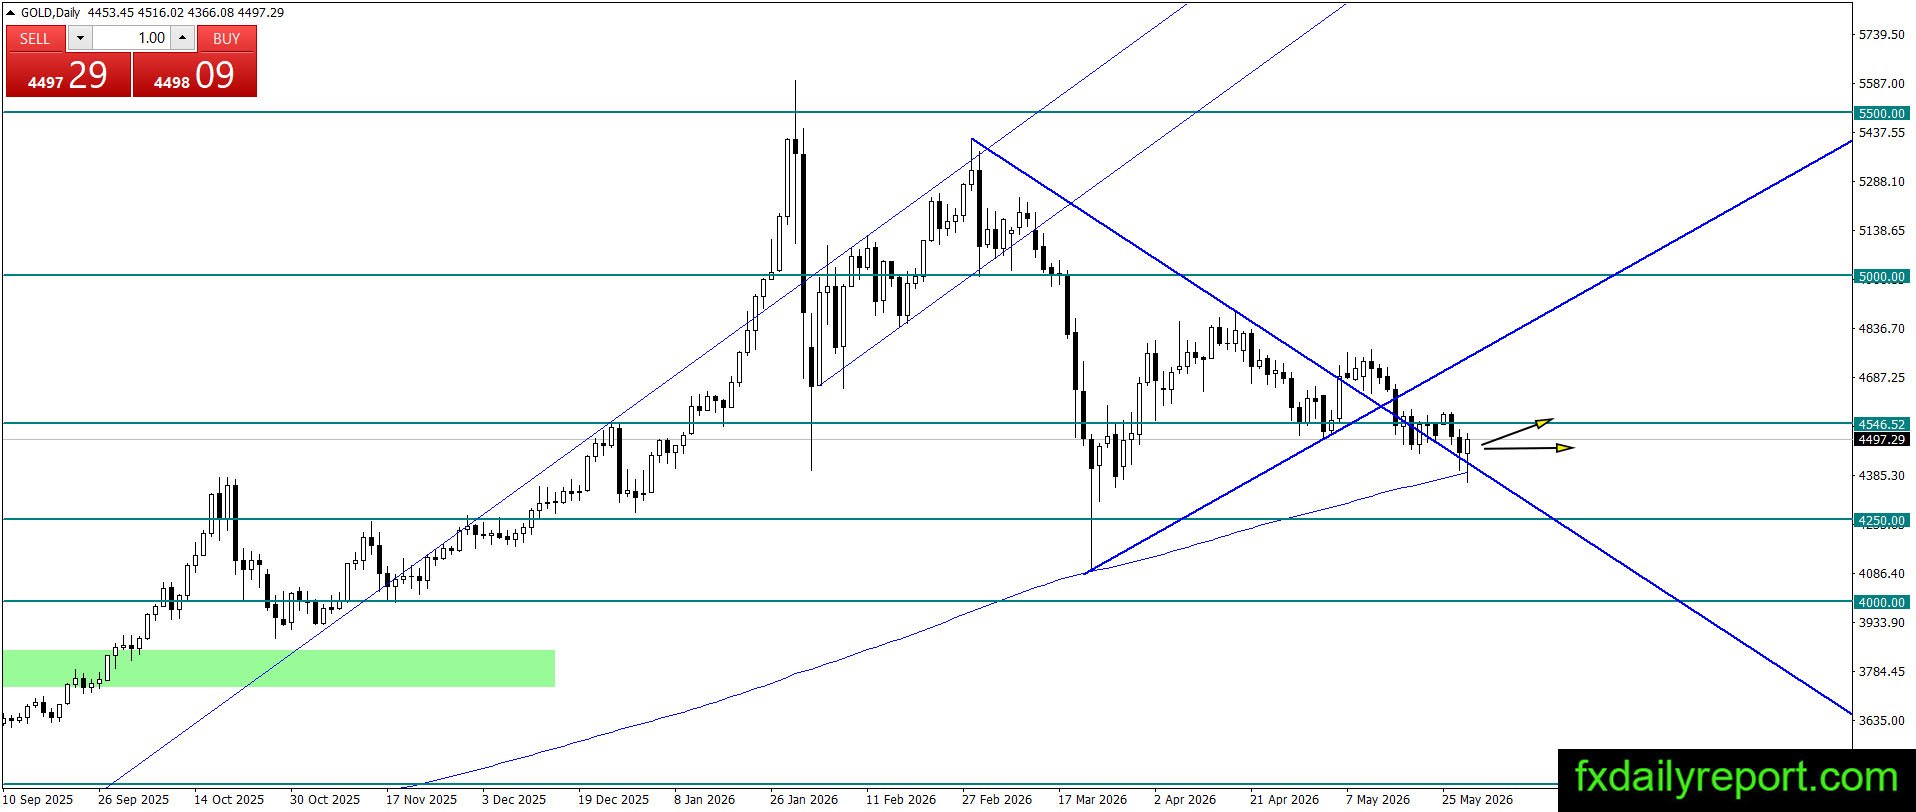
Gold staged a perfect bounce from its daily SMA 200 dynamic support line after facing intense initial bearish pressure during the session. The resulting price action is on track to print a bullish pin bar pattern by the close, where subsequent follow-through will be required to confirm a valid bullish reversal. However, to fully validate that a structural trend reversal is underway, buyers will ultimately need to push higher and print a fresh higher swing high. Until then, the market remains in a transitional phase as bulls attempt to reclaim control near these key technical averages.
Today’s critical levels to watch:

Support: $4,500, $4,380
Resistance: $4,546, $5,000, $5,200, $5,500
Silver defended trendline
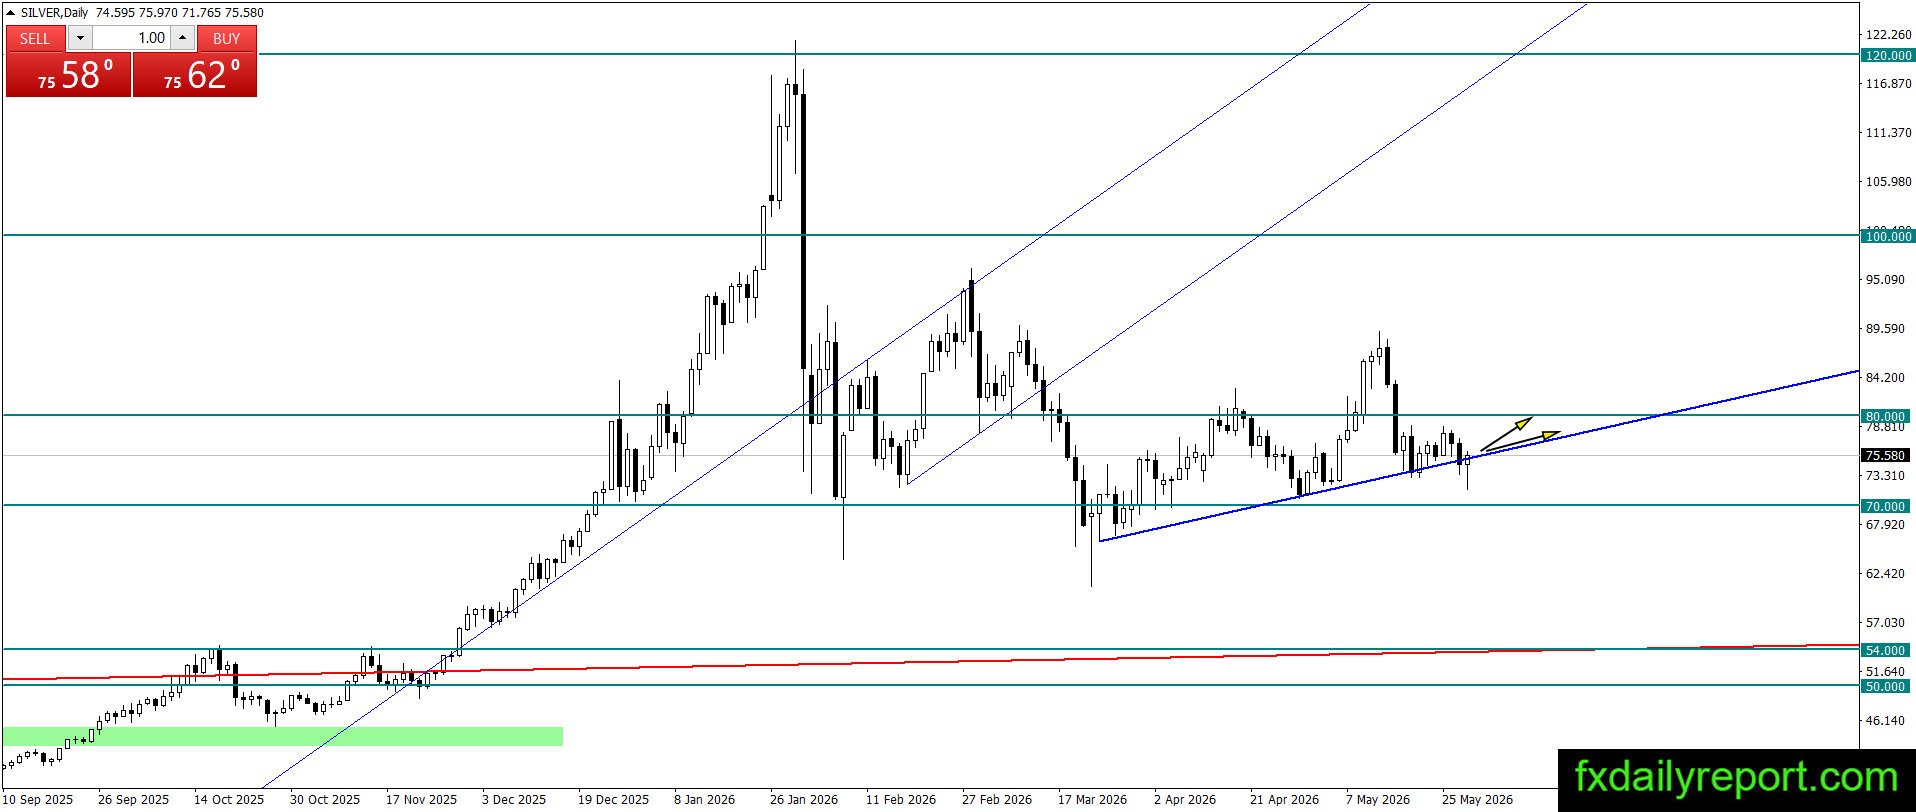
Silver successfully defended its primary ascending trend line today, showcasing resilient bullish reactions from key dynamic support. The metal is currently well-positioned to close the daily session as a bullish pin bar pattern, signaling strong buying interest at lower structural boundaries. On the upside, the $80.00 psychological milestone along with the latest swing high will serve as the immediate resistance levels to watch. A decisive breakout above these barriers is necessary to reignite the broader bullish macro trend and open the path for higher targets.
Today’s critical level to watch:
Support: $80.00, $70.00, $54.00, $50.00
Resistance: $83.91, $85.00, $100.00, $120.00
Crude oil stay below $90.00
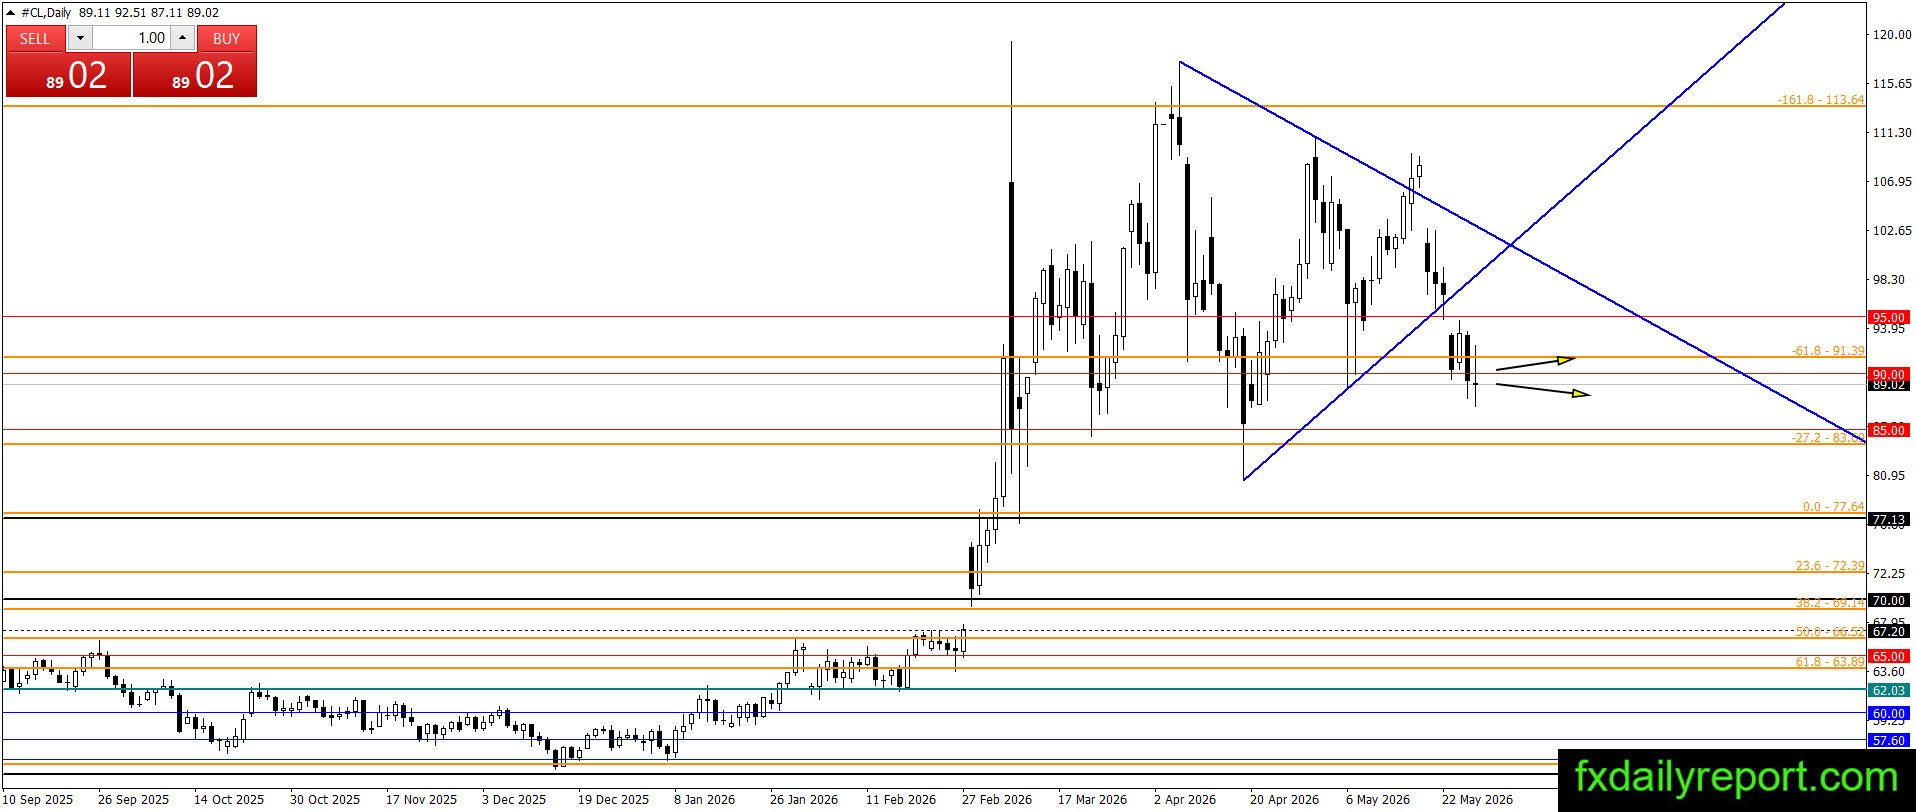
Crude oil initially attempted a bullish extension earlier today, but the upward move quickly lost steam and completely reversed course. The commodity is currently trading below its daily opening price, highlighting a clear failure by buyers to sustain levels above the critical $90.00 psychological mark. This technical rejection and inability to hold the $90.00 shelf could open the door for a deeper downside movement, with sellers likely accelerating momentum toward the next major horizontal support floor at $85.00.
Today’s critical level to watch:
Support: $90.00, $85.00, $80.00, $77.13
Resistance: $95.00, $100.00, $110.00