
Gold triggered stop loss


Gold make an interesting move today, the price slide through previous day low and create lower low. However, the selling encountered same buying pressure which moves the price back near its opening price. On the daily chart, if the price can close higher than its opening price then we will have bullish pin bar or hammer pattern. This pattern if triggered next week, might give the bull chance to bring the price near the broken $1,200 – $1,220 area.
In H4-chart, there is bearish trendline which acts as barrier, the bull need to close above it to continue the bullish momentum.

Today critical level to watch:
Support: $1,170
Resistance: $1,200, $1,220, $1,250, $1,260, $1,270
Silver intercepted sell
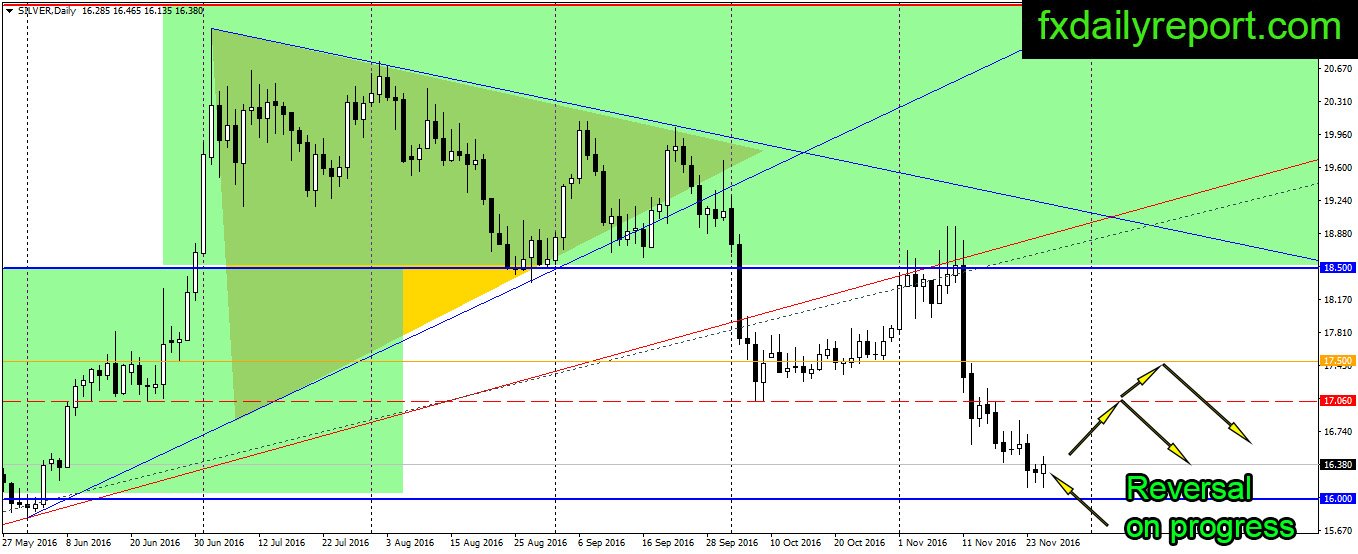
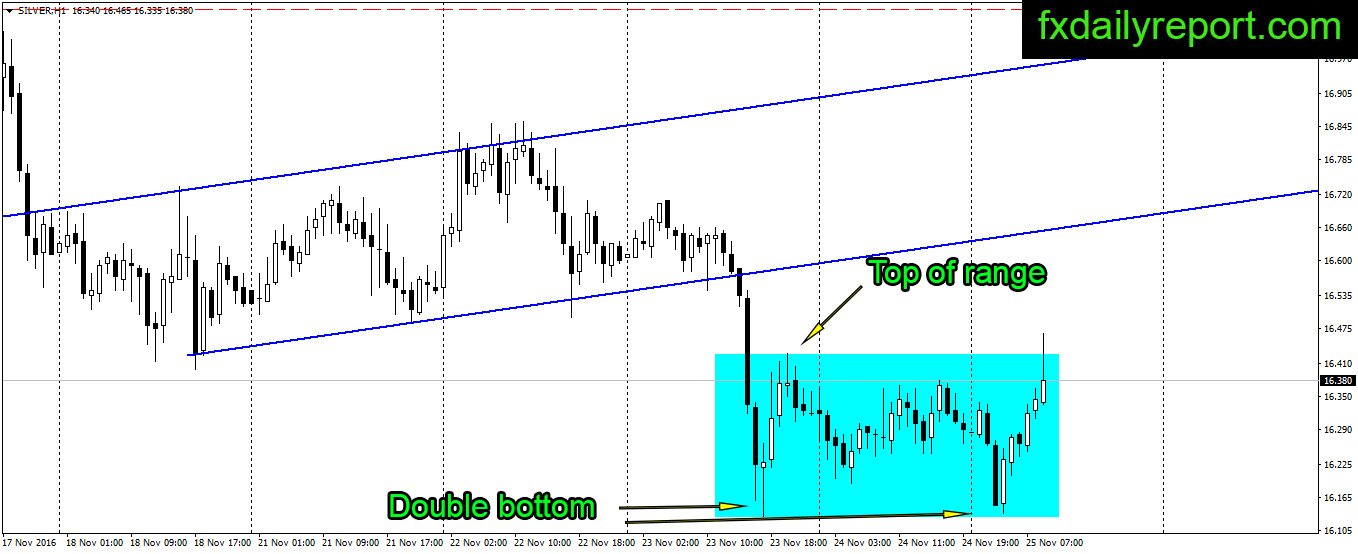
The price of silver have a similar experience as gold, it moves down in the early trading session and touches Wednesday low. The price bounced back above its opening price after tested the low. In H1 chart, we see double bottom formation which is a bullish indication.
Silver need to break above the blue range in H1 chart to confirm its reversal, the target of breakout is $17.
Today critical level to watch:
Support: $16.00, $15.80
Resistance: $16.50, $16.75, $17.00, $17.20, $17.50
Crude Oil undergo correction
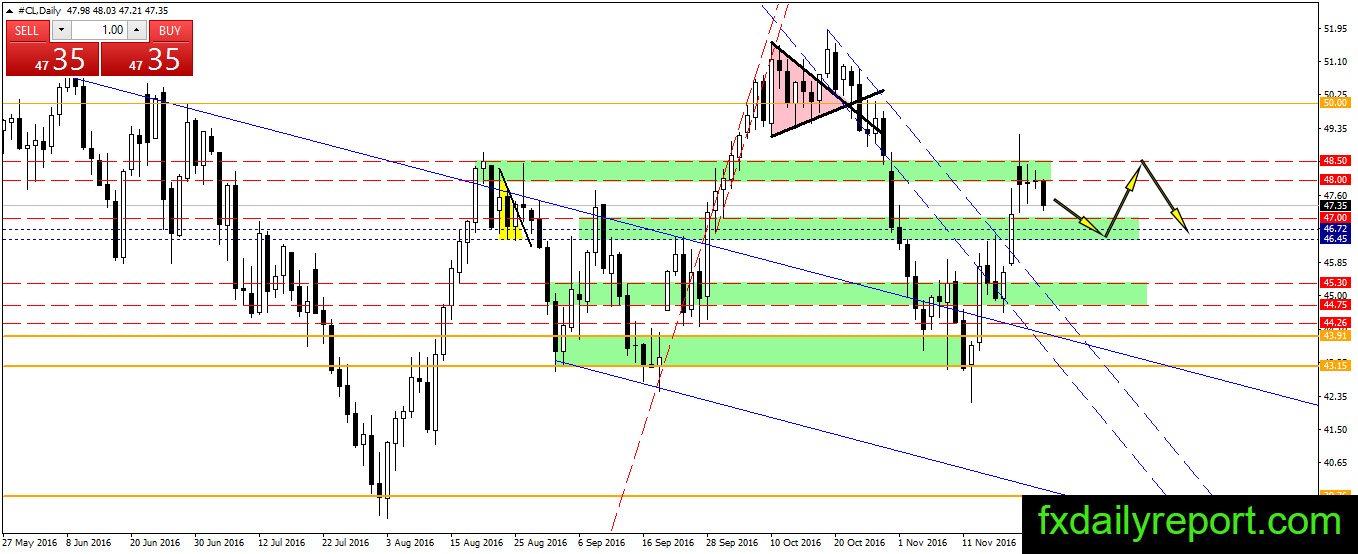
Unable to close above $48.00 – $48.50 resistance area, crude oil start to descend toward $46.5 – $47 support area. The price might continue moving between $46.50 – $48.50 before next week OPEC meeting. Expectation turned bullish, but it is mostly caused by short covering.
A supply glut, Iran, and Iraq reluctance to cut might lead to OPEC failure, but expect sharp short squeeze if all of OPEC member came out of the Vienna meeting in agreement.
Today critical level to watch:
Support: $47.00, $46.50, $46.20, $46.00, $45.30
Resistance: $48.00, $48.50