
Gold bullish engulfing pattern
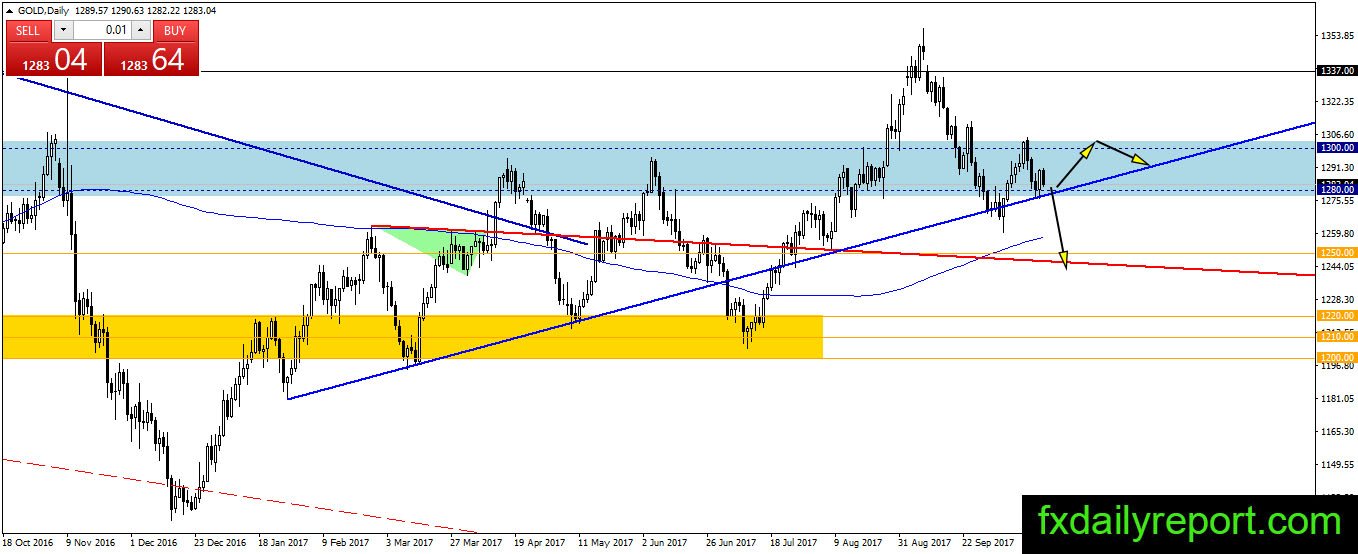
Gold produces a bullish engulfing pattern on the daily chart, bounced from the blue trendline and $1,280 support level. The bullish engulfing pattern, unfortunately, being sold by the bear at the current time. If the bull could not recover and close the price above the bullish pattern, it is possible for gold to break lower below the trendline and $1,280 support.

Today critical level to watch:
Support: $1,280, $1,258, $1,250
Resistance: $1,300, $1,313.22, $1337, $1,390
Silver compression on progress
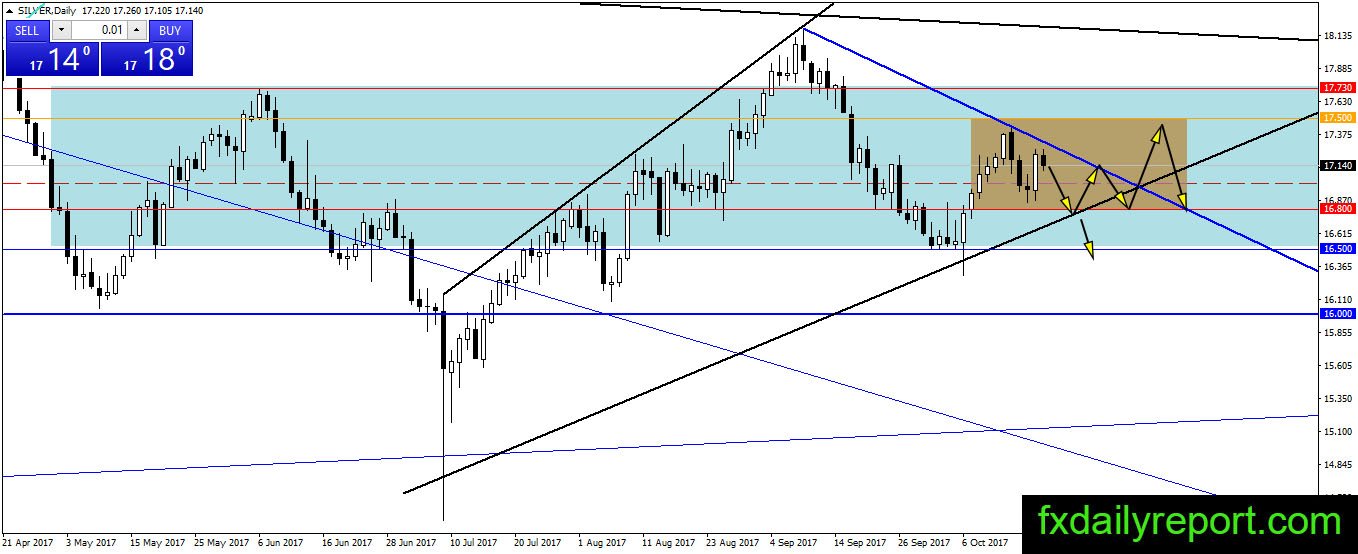
The price of silver got supported in the previous trading session. The precious metal jumped and closed above $17.00 escaping further sell-off. However, the range of movement might compress between $16.80 – $17.50 also between two trendlines. Currently, the price is moving lower on U.S dollar strength. Silver might continue lower to test $16.80 and the trendline.
Today critical level to watch:
Support: $16.80, $16.50, $16.00
Resistance: $17.00, $17.20, $17.50, $17.73
Crude oil double top confirmed?
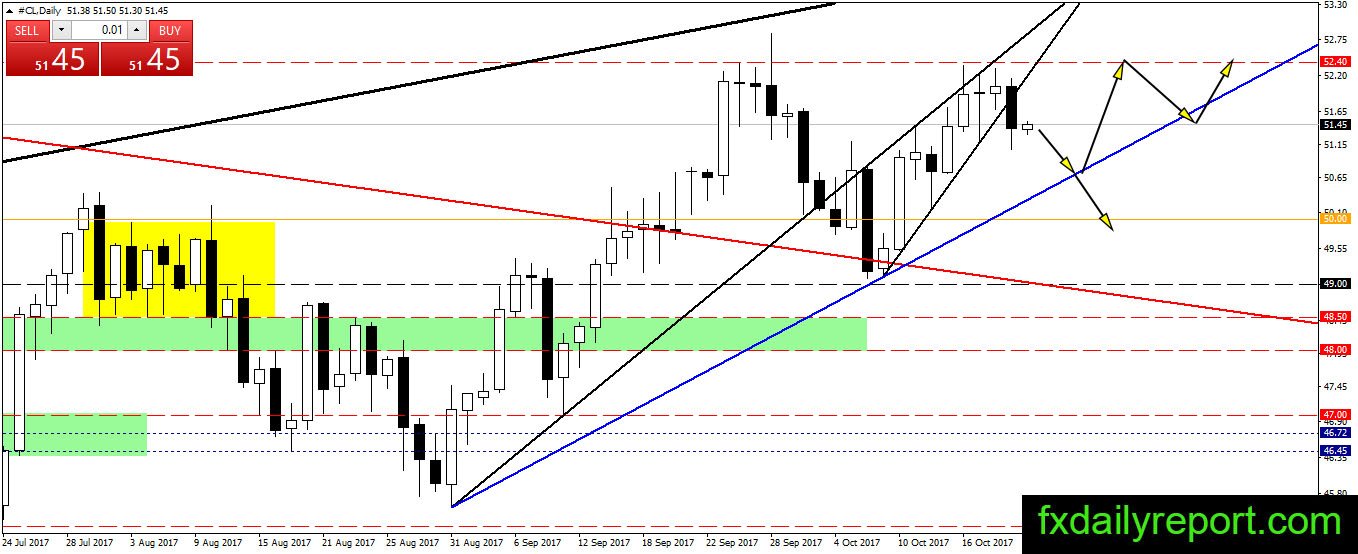
Crude oil blasted the Wednesday low and closed below its short-term trendline. Is it the time to sell crude oil? If the price of crude oil continues lower today and close below Previous day low, it looks like the selling will continue and target blue trendline. Further weakness might drive crude oil to the possible neckline of the double top at $49.00.
The breakout of neckline indicate the end of bullish leg since August and open the bearish scenario to $43.00 – $44.00
Today critical level to watch:
Support: $51.20, $51.00, $50.00
Resistance: $52.40, $54.50