
Is gold bull finally giving up?
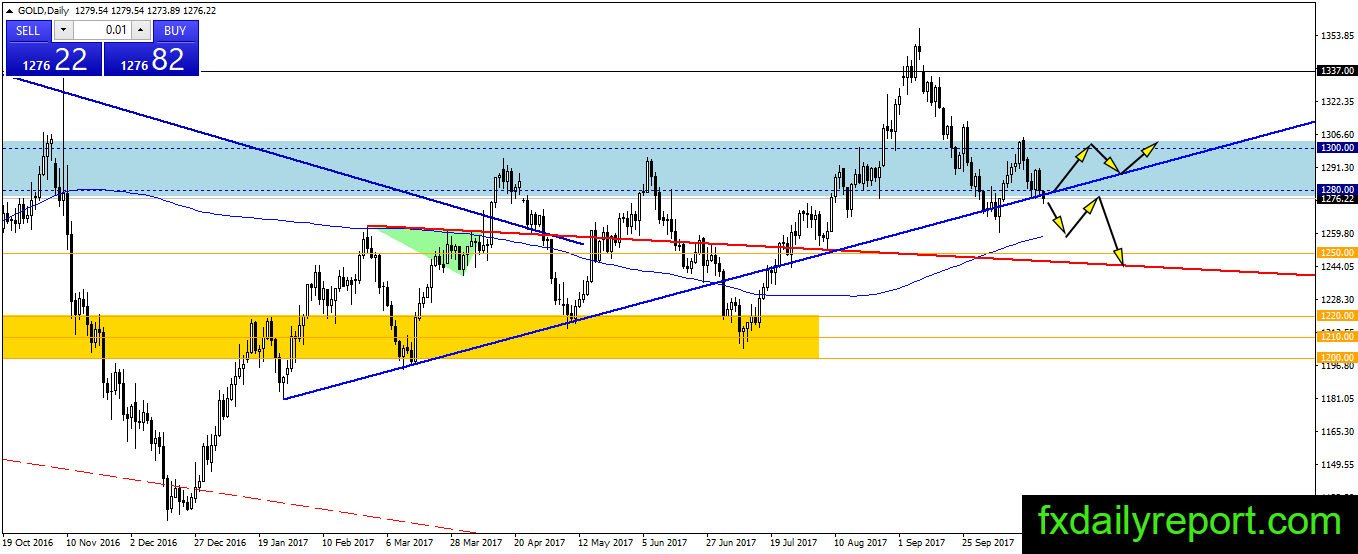
The gold slide below $1,280 and the support trendline today. The precious metal continues under pressure since the bounce from $1,280 could not lift the price to $1,300. If gold continues lower, it will target daily SMA 200 and might turn bearish for long-term.

Traders could wait for today closing price, if the bear could widen the advantage, we could see gold slide further lower.
Today critical level to watch:
Support: $1,258, $1,250
Resistance: $1,280, $1,300, $1,313.22, $1337, $1,390
Silver waiting for breakout
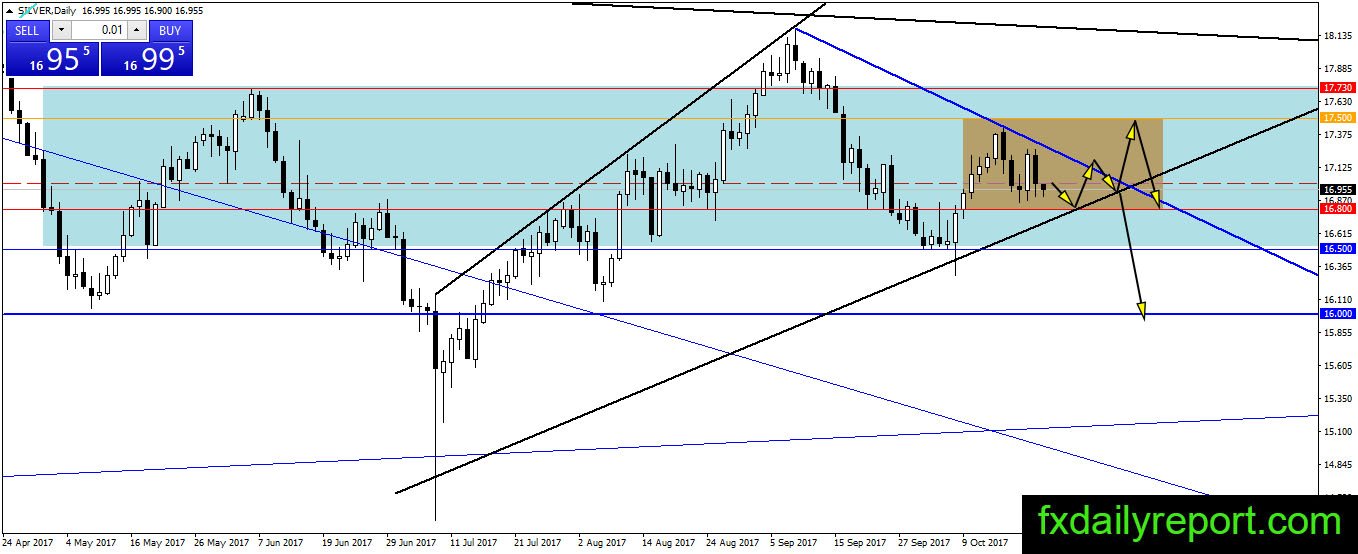
The price of silver is moving inside triangle consolidation and currently limited between $16.80 – $17.50. The situation favor for breakout lower as the high gets lower. However, as long as $16.80 hold selling pressure, silver could start a bounce higher above the triangle.
Today critical level to watch:
Support: $16.80, $16.50, $16.00
Resistance: $17.00, $17.20, $17.50, $17.73
Crude oil stick near $52.40
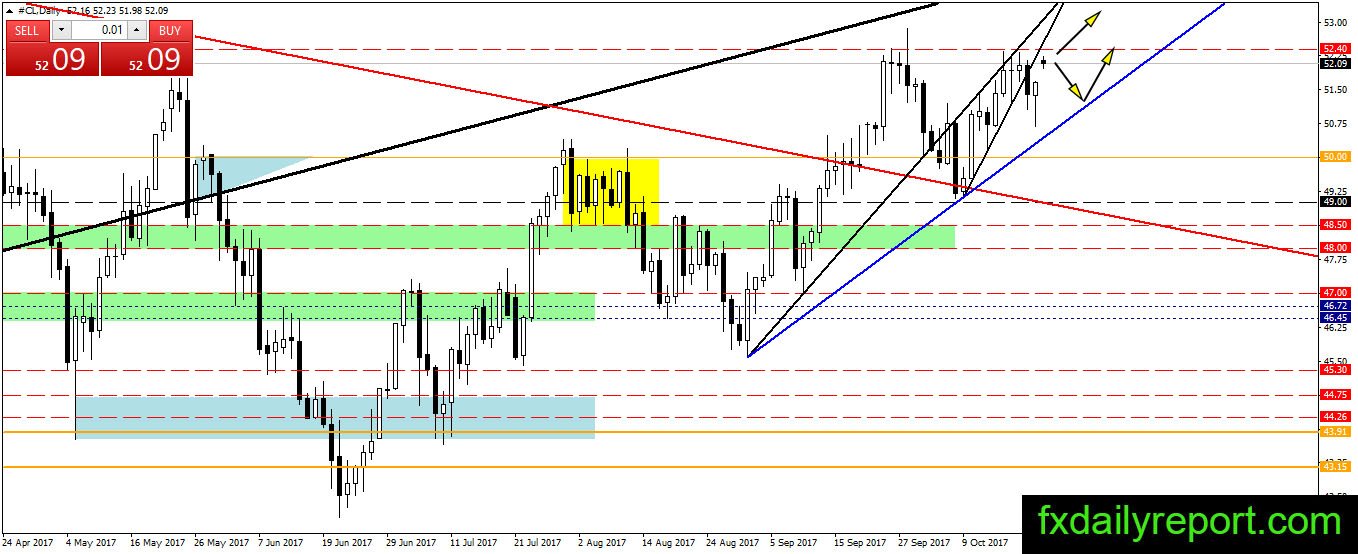
Crude oil rolled over to next month contract, and the price opened near $52.40 today. There is no momentum shown yet in today trading session. Traders could continue to observe reaction near the resistance. Will crude oil breakout above $52.40 this week? Alternatively, will it form a bearish candlestick pattern and start to descend?
Today critical level to watch:
Support: $51.20, $51.00, $50.00
Resistance: $52.40, $54.50