
Bullish pin on Gold daily chart
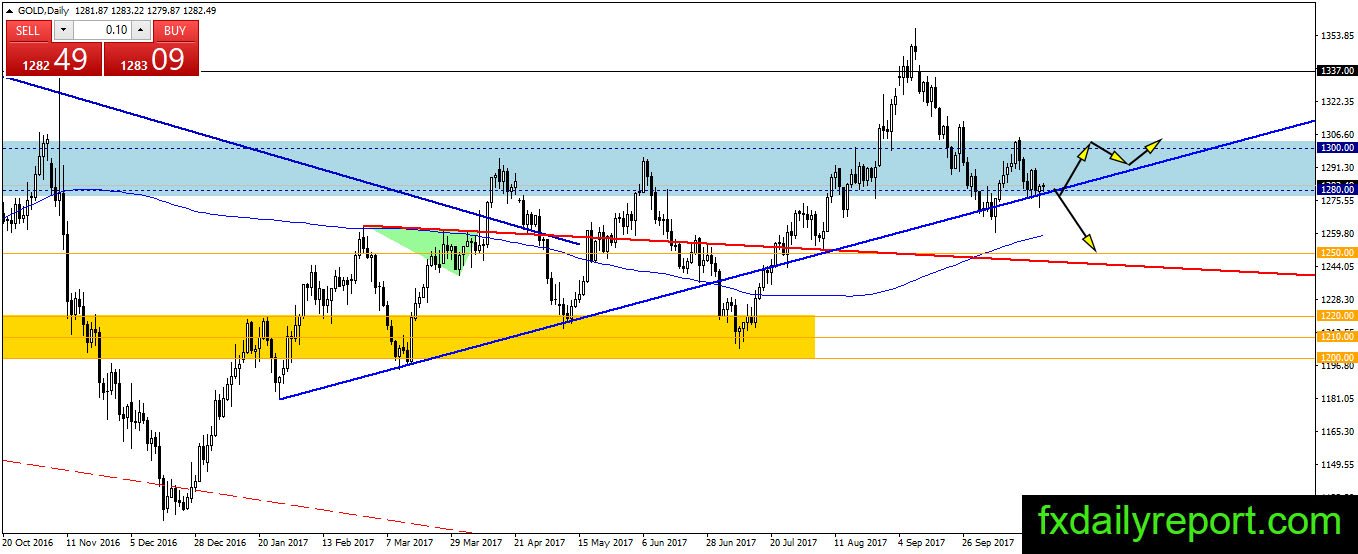
Gold on the daily chart escaped breakdown below $1,280 and closed the day with bullish pin. The closure of bullish pin coincides with trendline support which is bullish.If gold could move above the bullish pin high, it will target $1,300 and higher. However, further sell-off from current level and close below the trendline will trigger deeper correction toward daily SMA 200.

Today critical level to watch:
Support: $1,280, $1,258, $1,250
Resistance: $1,300, $1,313.22, $1337, $1,390
Silver bounce from lower range
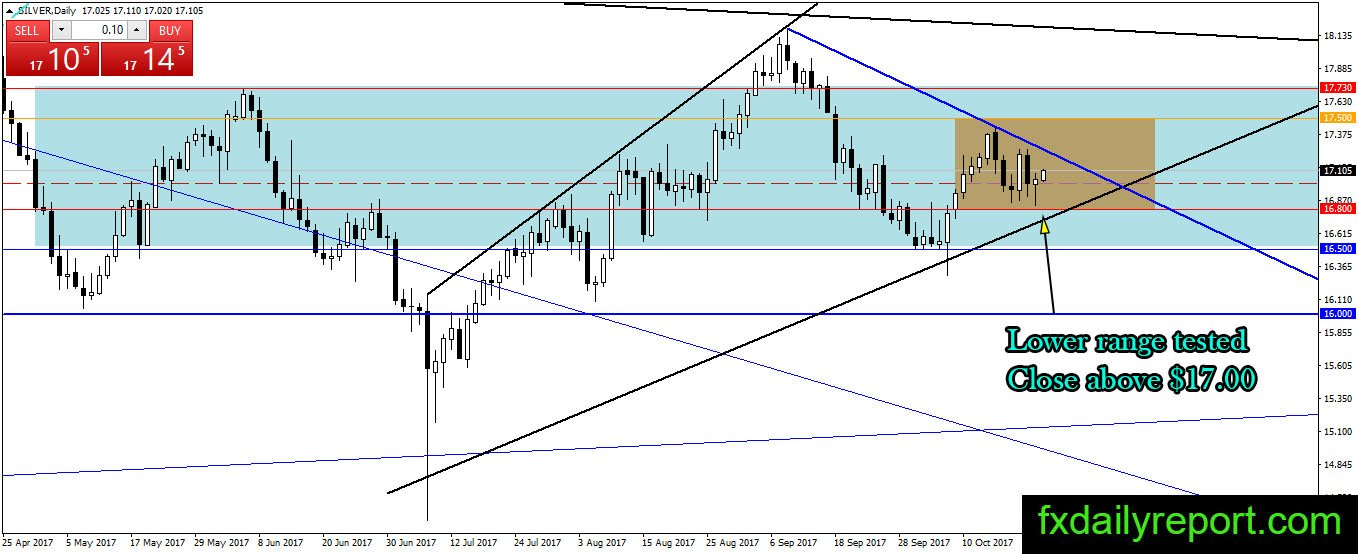
Silver has tested the lower range of consolidation on Monday, and the price closed above $17.00. It is possible for silver to move higher now to test the top of the triangle pattern and could extend to the top of the range at $17.50.
Today critical level to watch:
Support: $17.00, $16.80, $16.50, $16.00
Resistance: $17.20, $17.50, $17.73
Crude oil bearish reaction
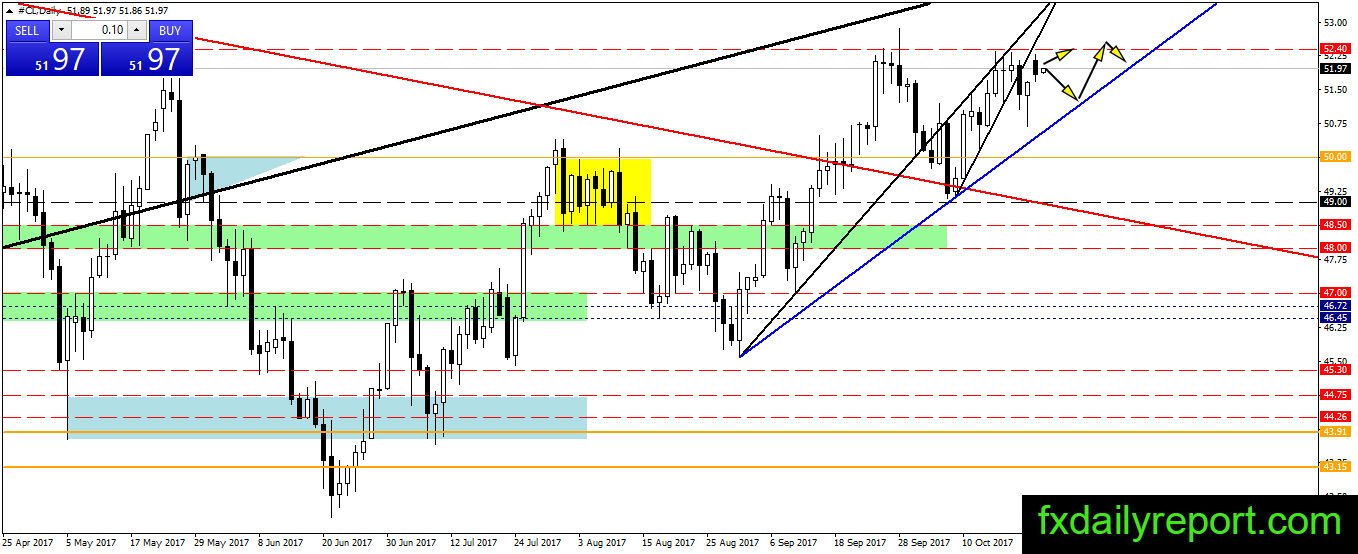
Crude oil opened higher on Monday as the monthly contract rolled over. Unfortunately for the bear, the price experience bearish reaction near the $52.40 resistance and the price fell. There is more room to close the gap on the daily chart, and the price might be limited between $51.00 – $52.40 before the breakout.
Today critical level to watch:
Support: $51.20, $51.00, $50.00
Resistance: $52.40, $54.50