
Gold back inside the triangle
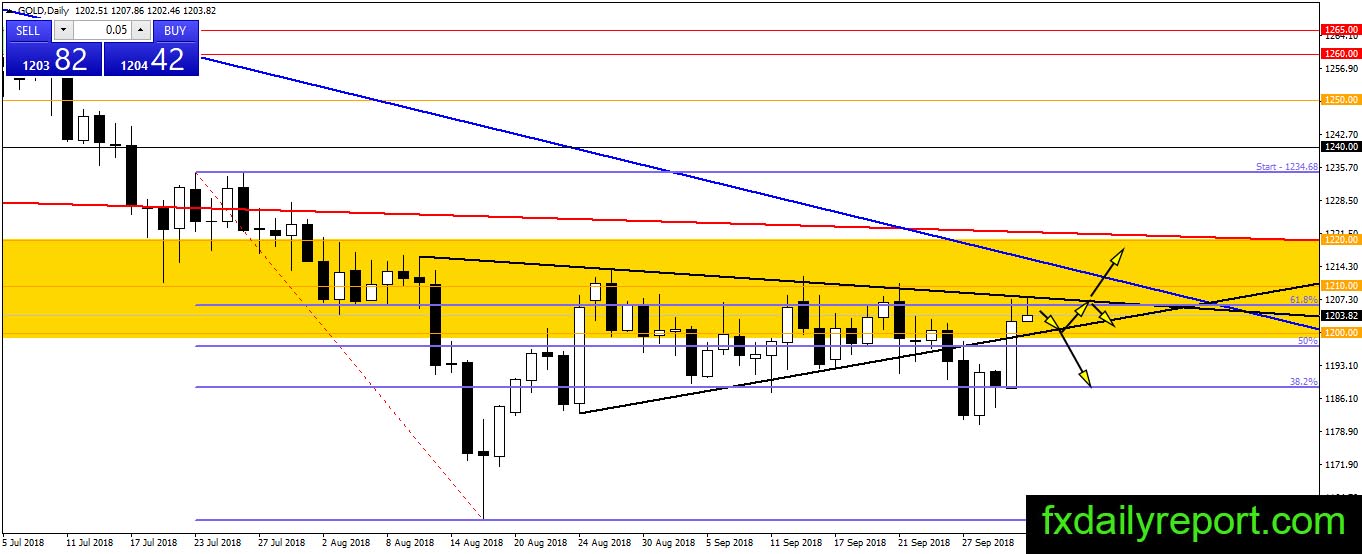
The bull returns to the market and pushes gold prices up inside the triangle pattern and above $1,200 handle. It is obviously bullish reversal by the bull and could continue in coming days. Currently, the price is testing the top of the triangle. If breakout happens then we will see gold in new medium-term bullish trend. The blue trendline and $1,220 is the upside target when breakout happens.

Today critical level to watch:
Support: $1,200, $1,160, $1,131.18
Resistance: $1,210, $1,220
Silver projected to trade between $14.40 – $15.00
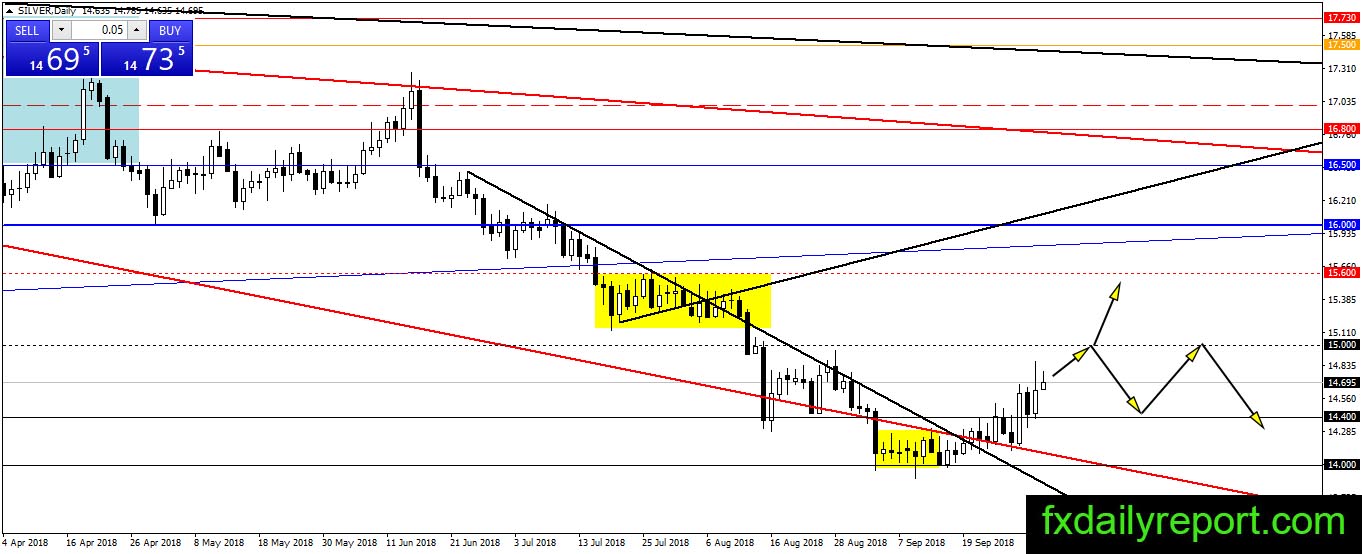
The price of silver gained in the previous day and bounce from $14.40 support level. We are convinced silver will trade between $14.40 – $15.00 now. The price expected to hit the top of the range in several days. However, there is U.S job data at the weekend. Traders could expect some volatility when the news release.
Today critical level to watch:
Support: $14.40, $14.00
Resistance: $15.00
Crude oil no weakness is seen

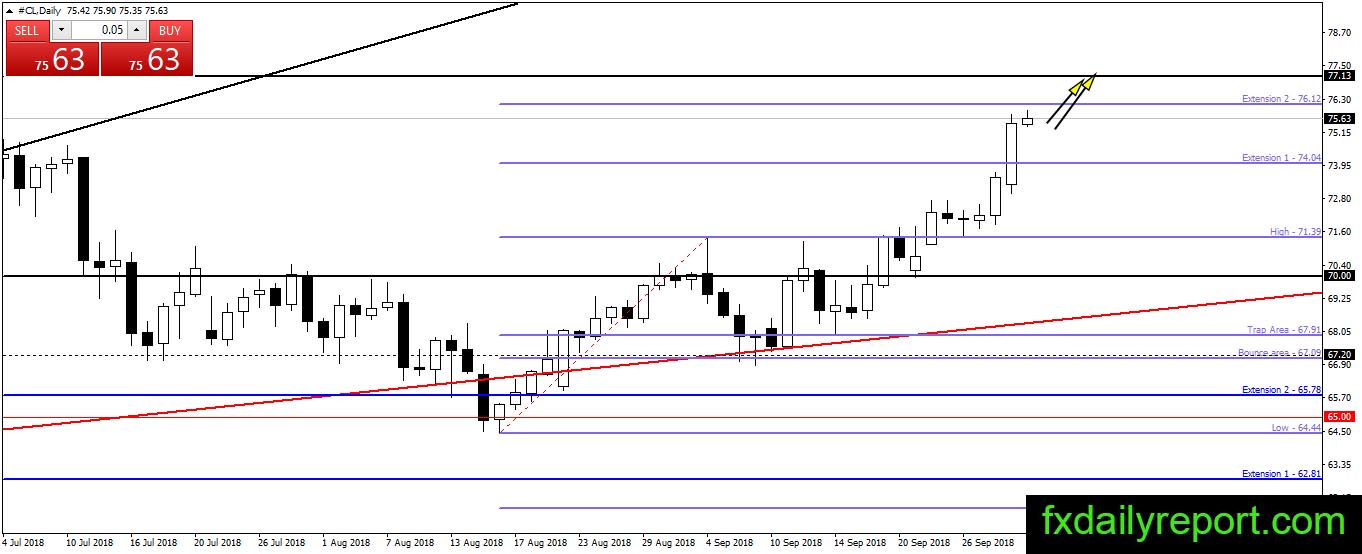
Crude oil on the path higher and there is nothing to reverse current bullish sentiment yet. Nearest resistance stays intact at $76.12 and $77.13. Traders will continue to ride the bullish movement and waiting for the bearish reaction near the resistance.
Today critical level to watch:
Support: $75.00, $74.80, $72.50
Resistance: $76.12, $77.13