
Gold supported by trendline but weak
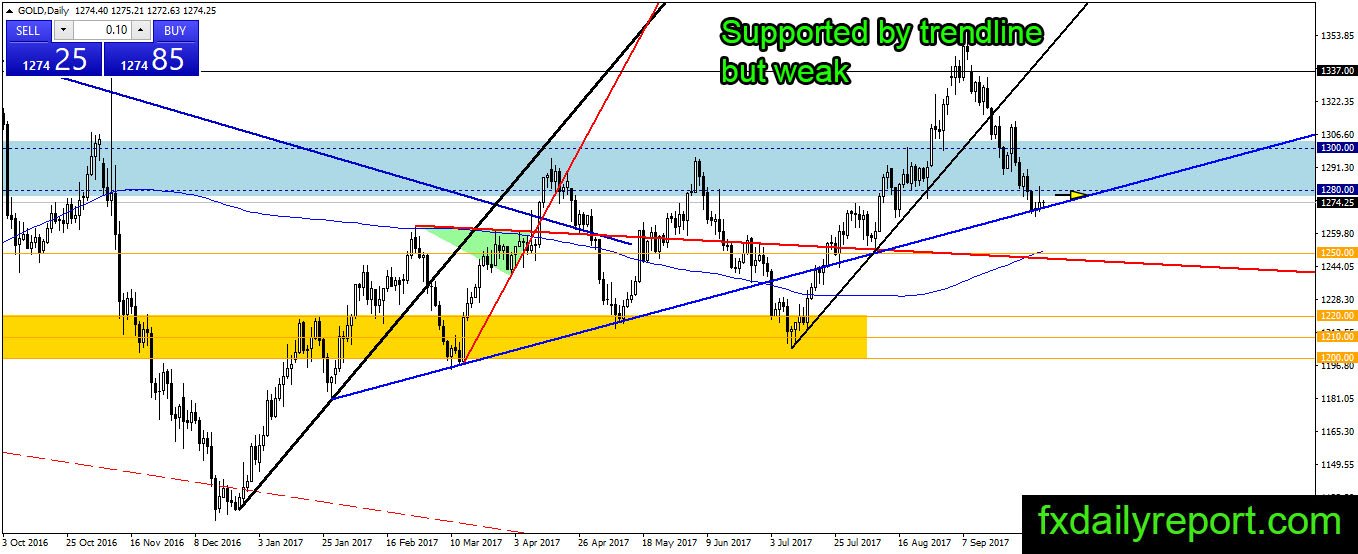
Gold attempted a bounce in the previous trading session. Initially, the price manages to move near $1,280, but it immediately sold by the bear. Currently, the price back near the support trendline and stick above it. The overall trend is bearish. If the bull could not push the price back above $1,280, gold is at risk of breakdown.

Today critical level to watch:
Support: $1,258
Resistance: $1,280, $1,300, $1337, $1,390
Silver direction down
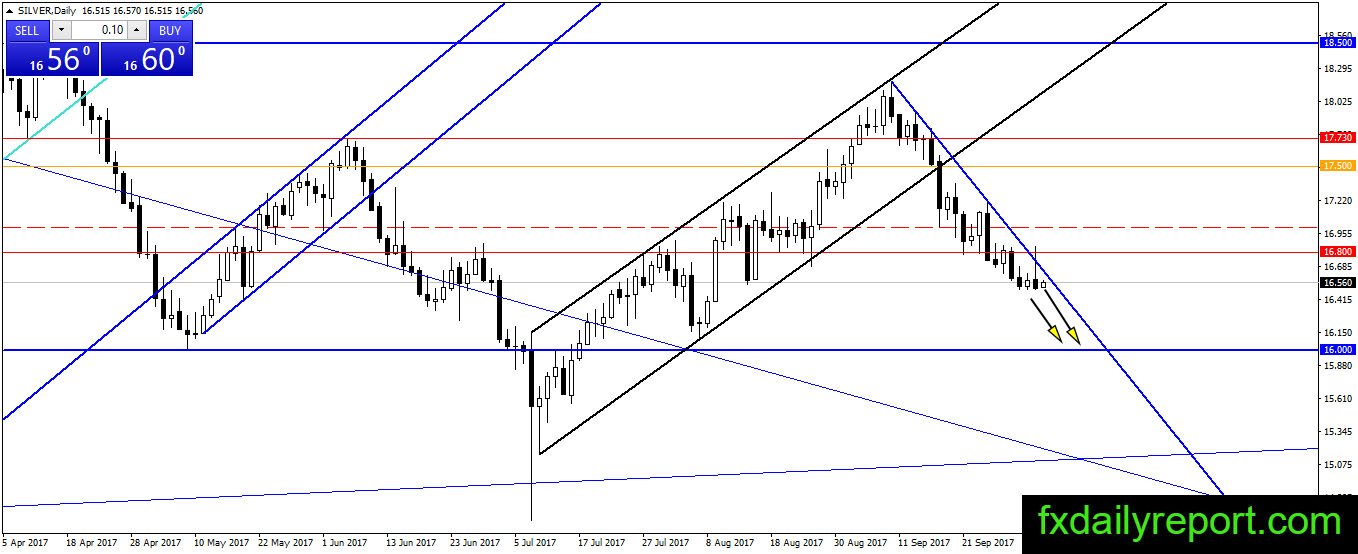
The bearish pin close of silver is one factor to consider for another lower move. The price well limited below the down trendline and hovering above $16.50. We might see another test of trendline today, but traders must also consider a break lower below $16.50.
Today critical level to watch:
Support: $16.50, $16.00
Resistance: $16.80, $17.00, $17.50, $17.73
Crude oil settled lower
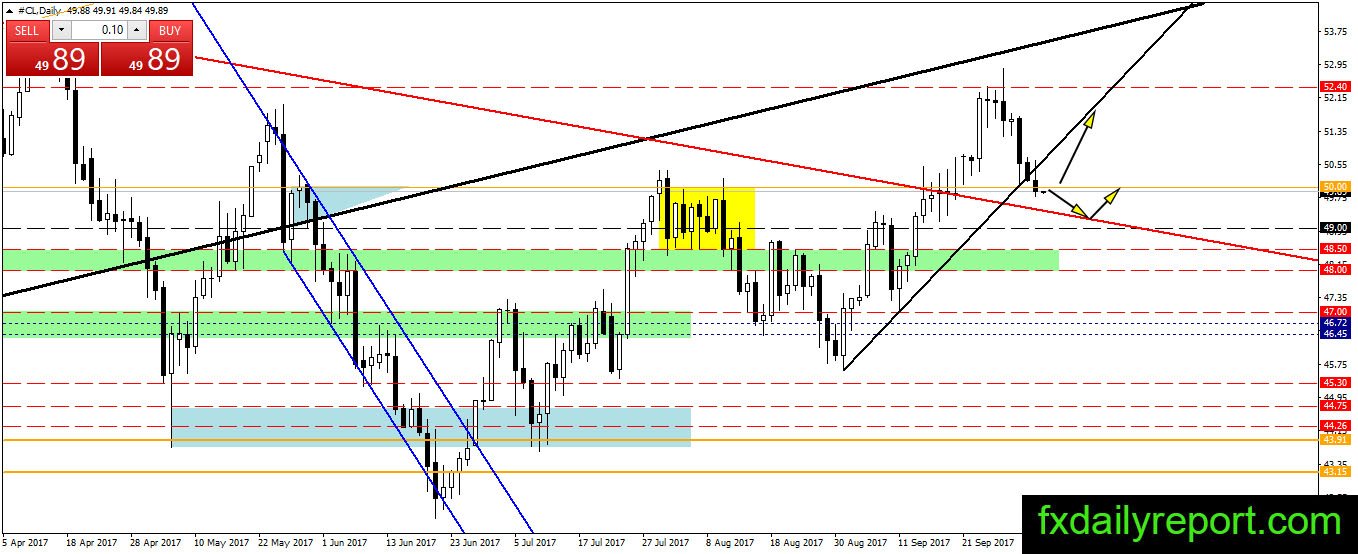
The final close of crude oil surprises the bull as initial bullish jump after crude oil inventory data turned bearish. Crude oil settled lower rejected from its trendline and might continue lower today. If the price moves downward today, it will test the red trendline. Traders could look for long position near the trendline or $49.00 level.
Today critical level to watch:
Support: $49.00, $48.50
Resistance: $50.00, $51.00, $52.40