
Gold slip on Monday
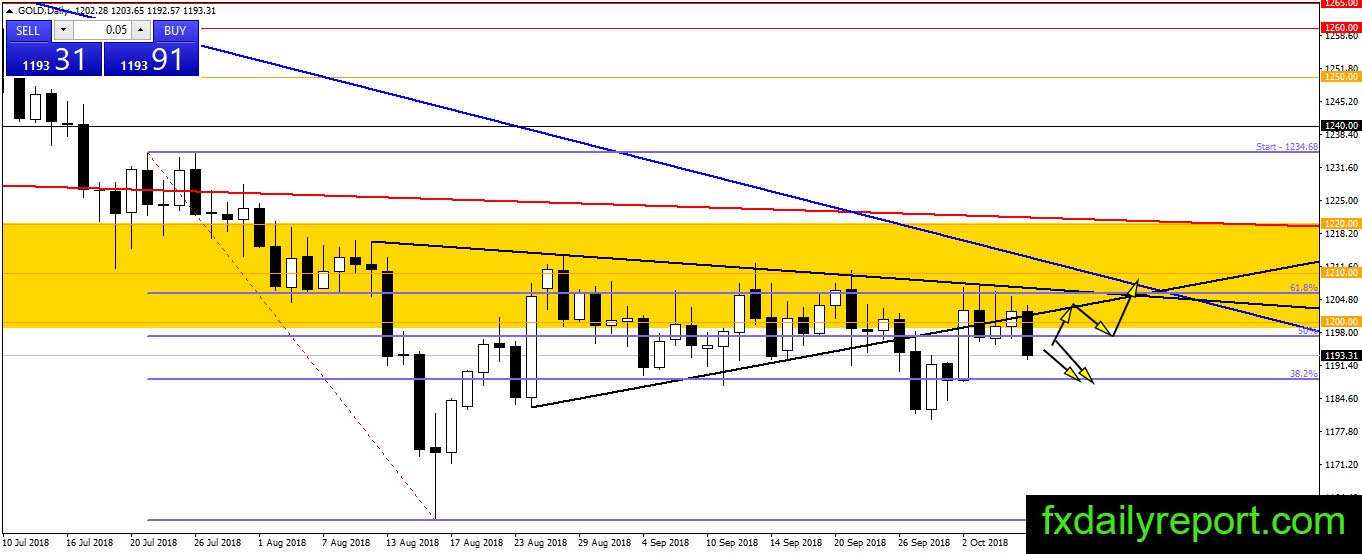
Friday has been a day to cheer for the bull as the gold move back inside the triangle and stay above $1,200. However, increase in U.S bond yield shatter the market confidence and push gold prices down below $1,200 with strong momentum. Because of strong downward movement, traders could expect the precious metal will continue lower to test 38.2% Fibonacci level around $1,188.

No position suggested yet in the current situation.
Today critical level to watch:
Support: $1,188, $1,160, $1,131.18
Resistance: $1,200, $1,210, $1,220
Silver supported at $14.40
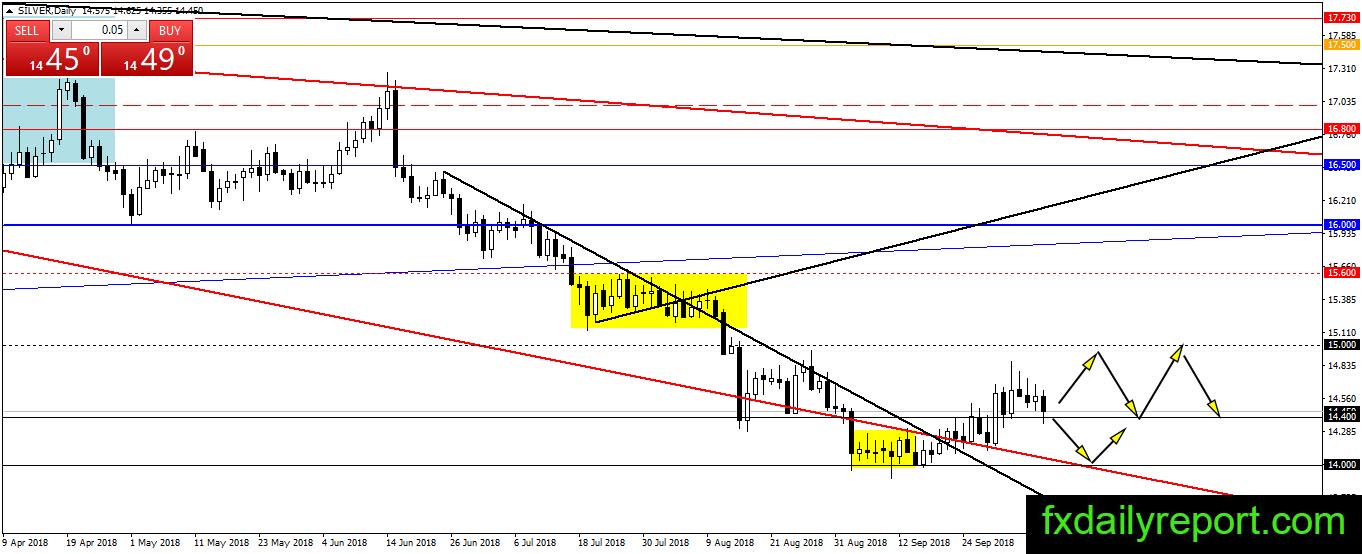
Silver has climbed to $14.40 – $15.00 area and currently the bear testing if the bull will hold the precious metal inside the area. $14.40 is being tested and currently, the bull still has upper hand. Will the bull maintain the price above $14.40 until the end of the trading day?
Today critical level to watch:
Support: $14.40, $14.00
Resistance: $15.00
Crude oil deeper correction
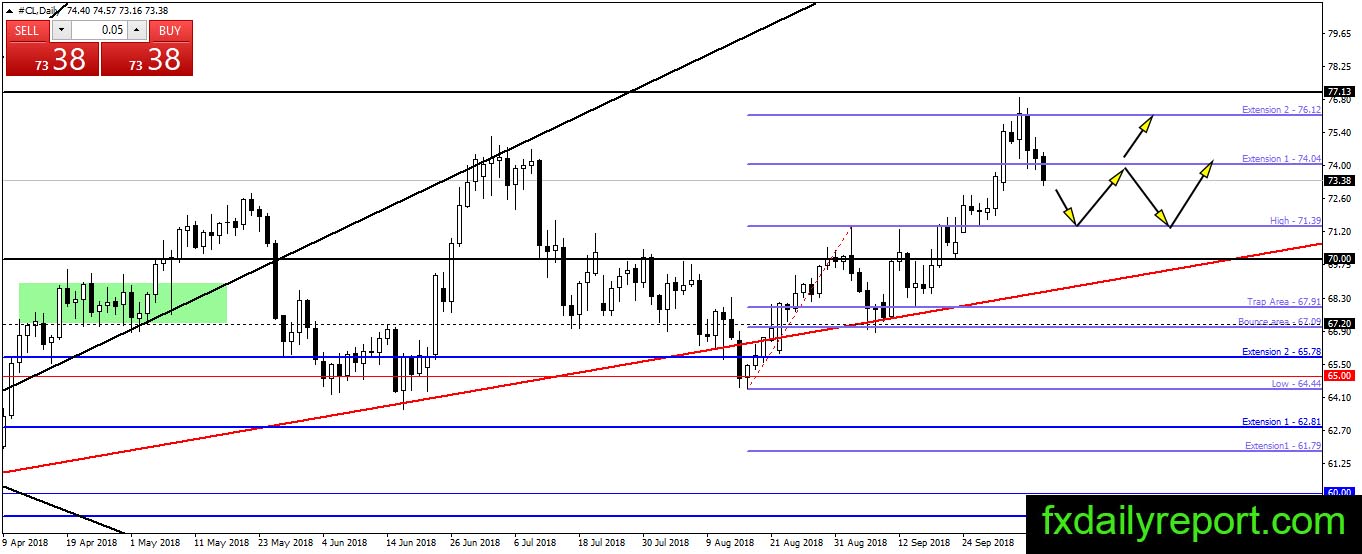
Two days bearish close followed through by the bear today, crude oil slip below $74.04 and looks will continue downward until it reaches $71.39. Long position near $71.39 is the best scenario to follow when correction stopped.
Today critical level to watch:
Support: $71.39, $70.00
Resistance: $74.04, $74.80, $75.00