
Gold start a recovery.

The price of gold was under pressure in the previous week as it broke below $1,280. The bear printed new low on Friday, but the bull manages to reverse the selling and turn the day bullish. Today, gold bull seems to attempt to build momentum upside higher than $1,280. Traders will look at $1,300 as resistance level and place to look for short position when bearish reversal happen.

Today critical level to watch:
Support: $1,280, $1,258, $1,250
Resistance: $1,300, $1337, $1,390
Silver escaped from down trendline
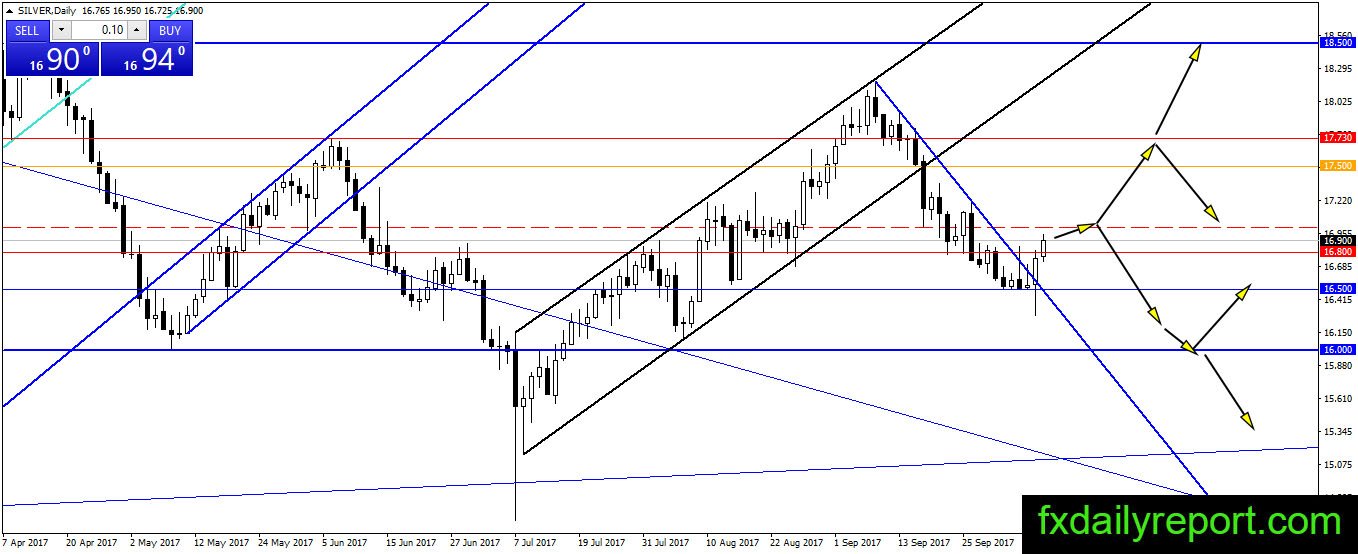
The price close on Friday as bullish engulfing help silver turn the trend into bullish today. The price break above Friday high also the bearish trendline on the daily chart. The bull needs to remove $17.00 from its path to continue the bullish advance toward $17.50 – $17.73.
Today critical level to watch:
Support: $16.80, $16.50, $16.00
Resistance: $17.00, $17.50, $17.73
Crude oil
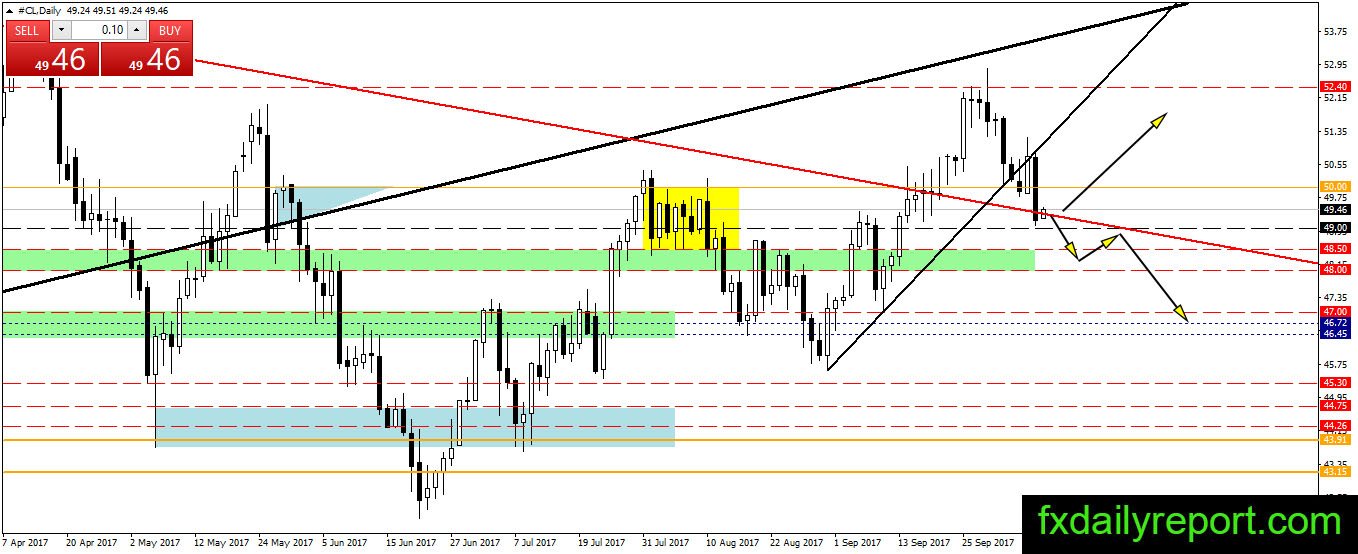
Crude oil is losing ground on Friday and fell to the red trendline. The outlook seems bearish for short-term, and if there is no bounce or bullish candlestick formed, the black gold might continue its downward movement toward $48.00 – $48.50.
The initial bounce might happen near $49.00. But, a break below $48.00 is confirmation for medium-term bearish continuation.
Today critical level to watch:
Support: $50.00, $49.00, $48.50
Resistance: $51.00, $52.40