
Gold inside the triangle consolidation
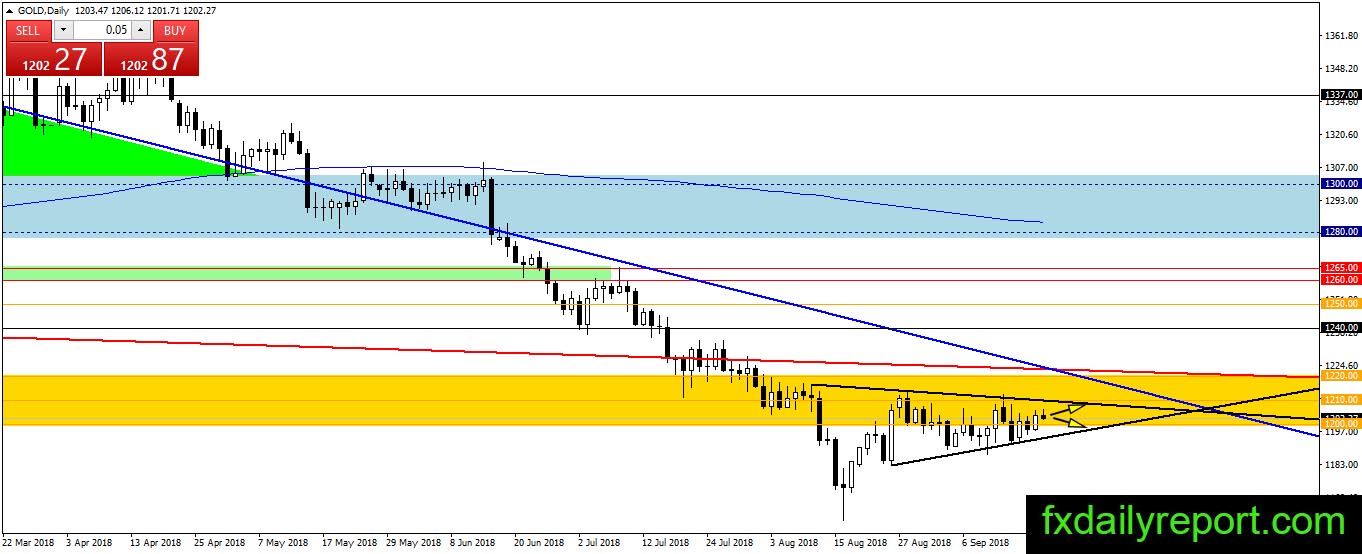
There is no winner between the bull and the bear yet as gold traded inside the triangle pattern on the daily chart. We will continue to monitor the price movement and expect no breakout this week. There is no clue yet on the next medium-long term direction. Gold could either breakout lower below $1,200 and continue its bearish trend this year or halted the drop and climb above $1,220 to reverse the bearish trend.

Today critical level to watch:
Support: $1,200, $1,189.20, $1,160
Resistance: $1,210, $1,220
Silver not much progress
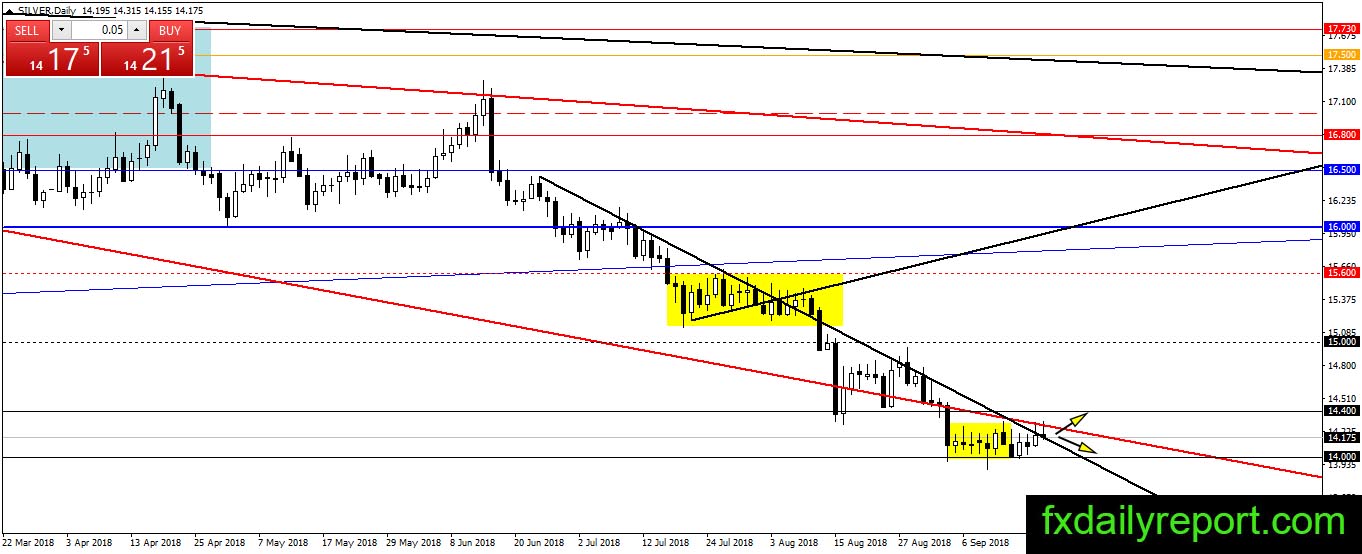
Silver mostly sideways inside the yellow box and seems will continue the ranging movement inside the box until the close of this week. The range expected to span between $14.00 – $14.40 until breakout happens. As the long-term trend is bearish, traders might want to stick to the bearish side.
Today critical level to watch:
Support: $14.00
Resistance: $14.40, $15.00
Crude oil major bullish development
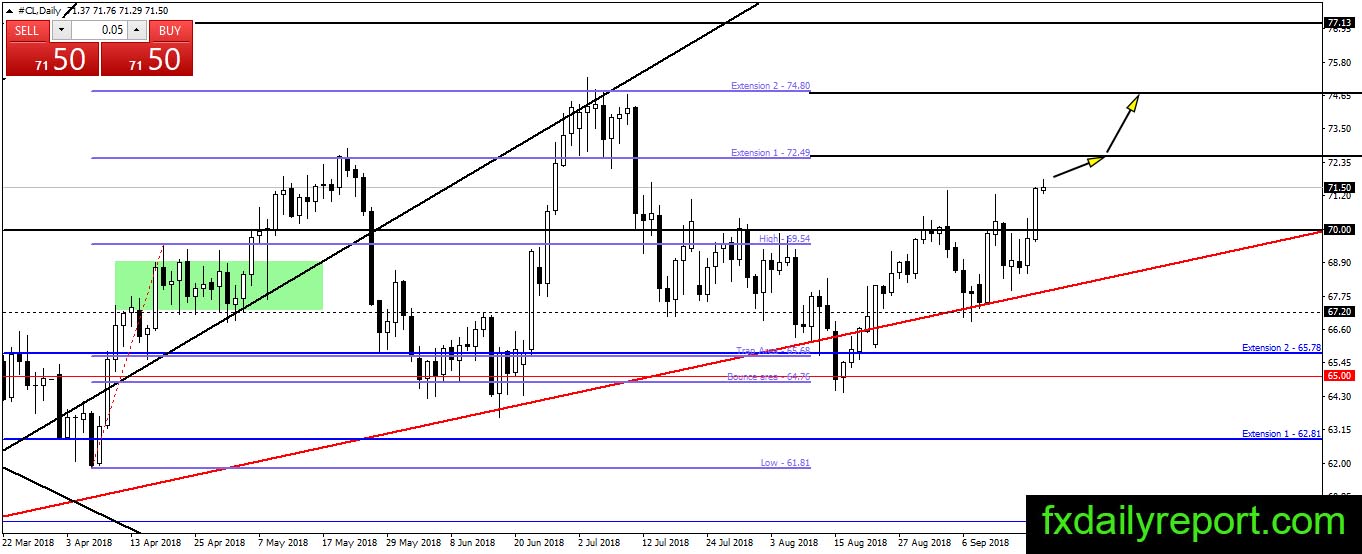
Crude oil manages to climb and close above $70.00 handle despite the narrower deficit than expected. U.S crude oil inventory logged a deficit of 2.1 million barrels vs. a deficit of 2.7 million barrels expectation. If crude oil continues its upward movement then $72.49 – $74.80 is the upward target.
Today critical level to watch:
Support: $67.20, $65.78, $65.00
Resistance: $70.00, $72.50