
French election shakeout
Global market news painted the sentiment on U.S stock market. China recently confronts North Korea and voice disagreement on Nuclear also missile launch done by the country. The market hopes this confrontation could bring the tension down. On the other front, French will hold an election which will put the fate of Eurozone on the line. Four candidates are running for the presidential position, and two of the candidate are anti-European Union.
French election will be held on 23rd April, and the result surely will give much impact to the market. Asian stock market and European stock market mostly up except for Nikkei and FTSE UK which is little changed. Dow Jones Industrial Averages futures advance 44 points before market open.
Technical Analysis
Dow Jones Industrial Averages (INDU)

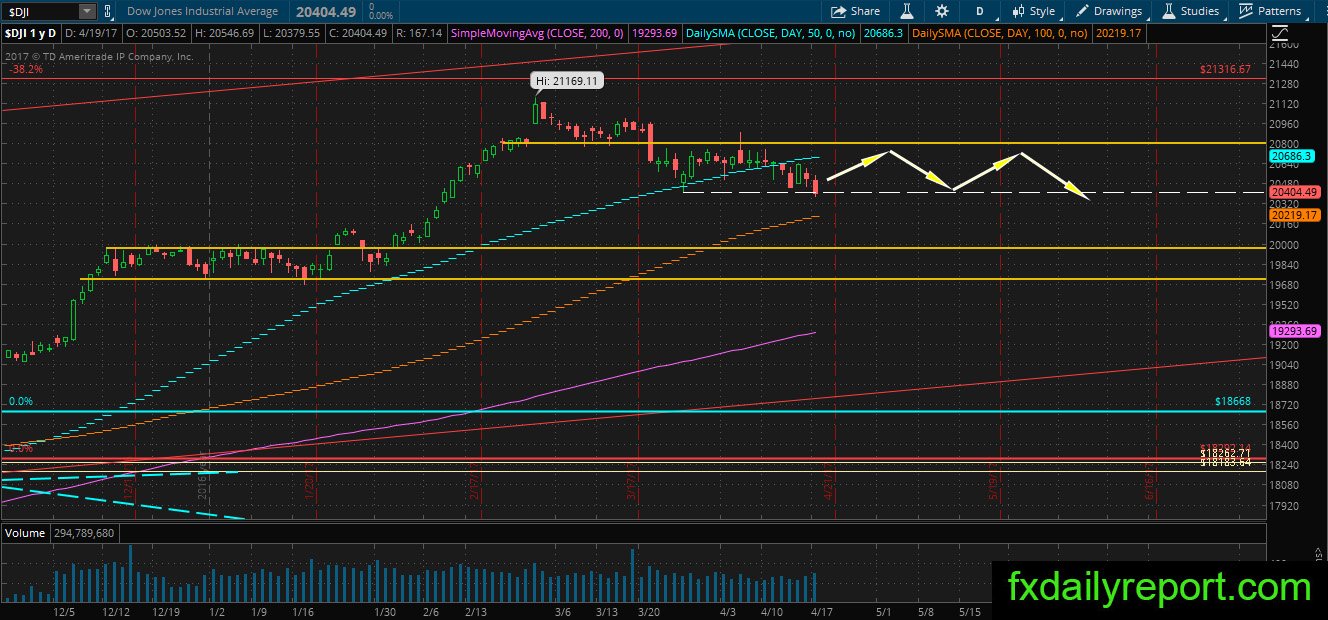
The index starts moving lower below previous extreme low 20,412. Although it is not significant, the weakness of DJIA is of concern in the long-term. Today, the index might bounce from the bottom of consolidation area, start moving up and continue the sideway movement between 20,400 – 20,800.
Merck & Co (MRK)
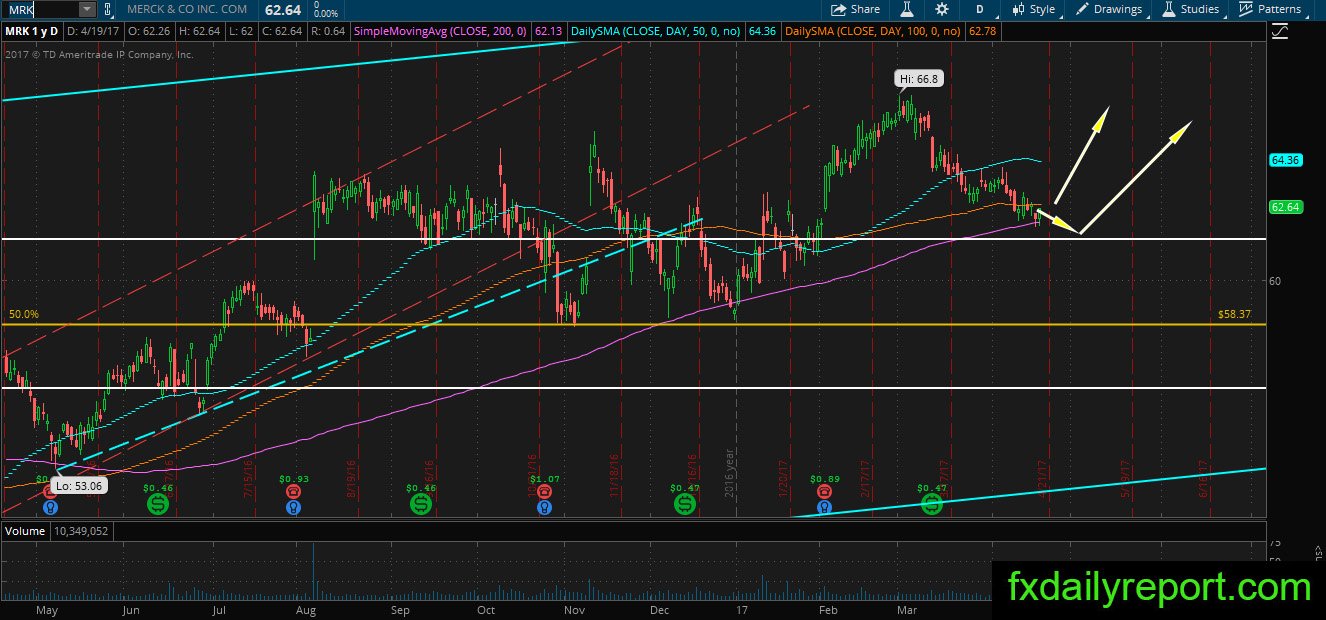
MRK is slowly moving down before next earnings report scheduled on 2nd May next month. The price touched the daily SMA 200 and might bounce from it. If the price continues lower, there is strong support trendline at $61.50 which might reverse the selling.
Walmart (WMT)
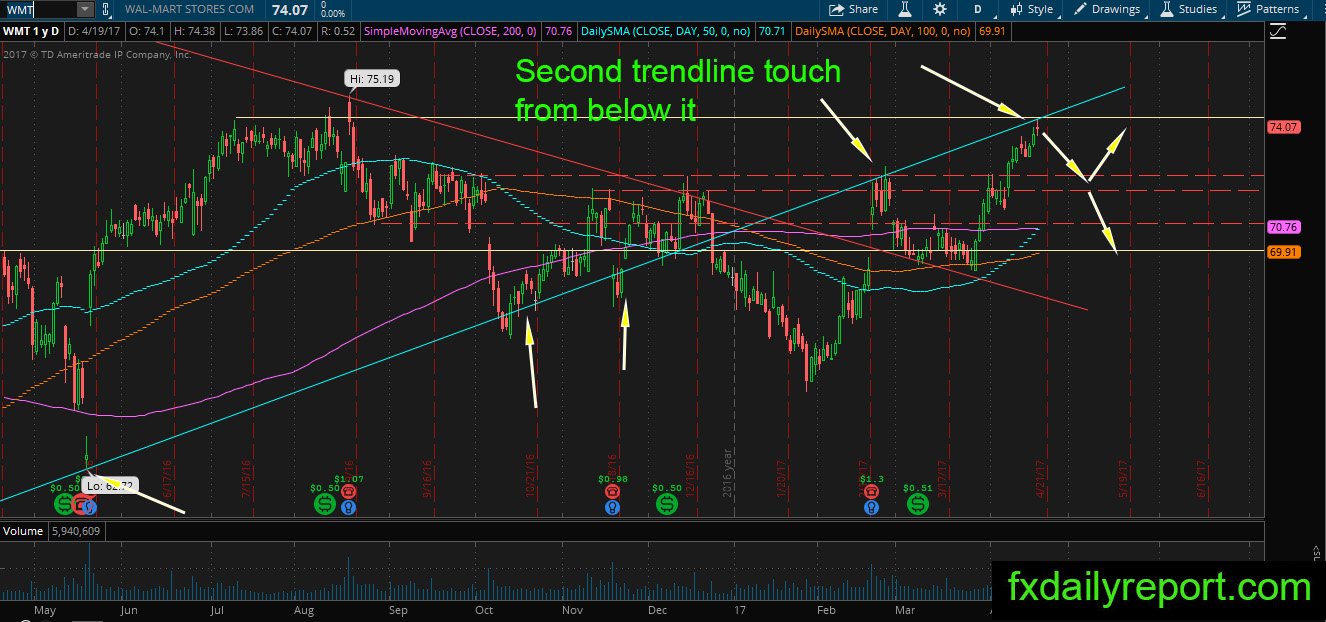
The touch of daily blue trendline on WMT daily chart could be the start of a correction in WMT share prices. Aside from the trendline, there is resistance around $74.50 which doubling the reason. Short position with stop losses around $75.19 might result in a successful trade.
Other Watchlist
IBM – earnings result and guidance received as disappointing which blew the share price lower. It currently sits near long term level $160 and the 38.2% Fibonacci retracement level. Traders could observe price action near the level.
YHOO – bearish engulfing pattern
PEP – bearish harami pattern