
Another bullish day
U.S stock market prepares for another bullish day as the stock market futures gaining before market open. There are two major things to note. First, President Donald Trump expected to announce the tax reform policy on Wednesday. Second, the government faces a possible shutdown on Saturday if the Congress do not pass the spending bill. The Hot issue is talking about funding for Trump border wall.
Major indices in Europe and Asia advances the second day after French election result. The major move might come from ECB conference scheduled on Thursday, and this conference will disburse ECB stance on interest-rate this year.
Technical Analysis
Dow Jones Industrial Averages (INDU)

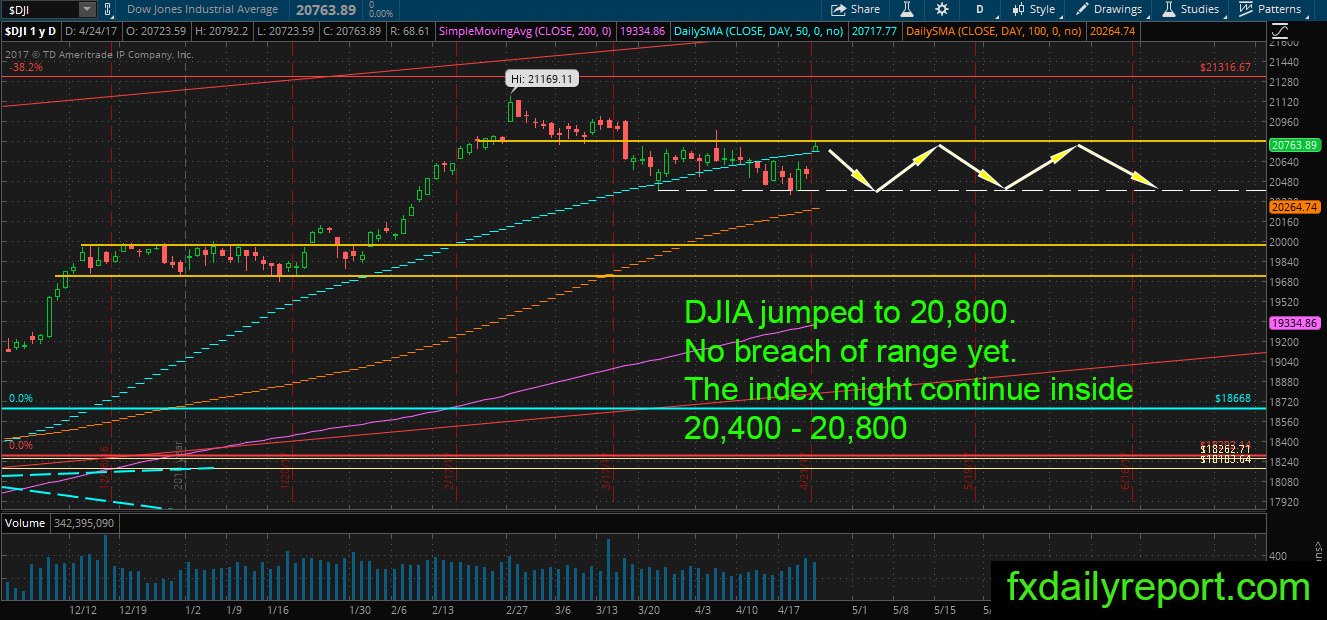
The index finished right near 20,800 on Monday which tell the market more test before confirmation. Today, Dow Jones Industrial Averages expected to continue its upward movement above resistance 20,800. Depend on the bullish momentum; the bear might come back into the market and reverse all gain at the end of the day.
20,800 is the best place to look for a short position, but at this time traders need confirmation from bearish candlestick pattern.
Alcoa Corporation (AA)
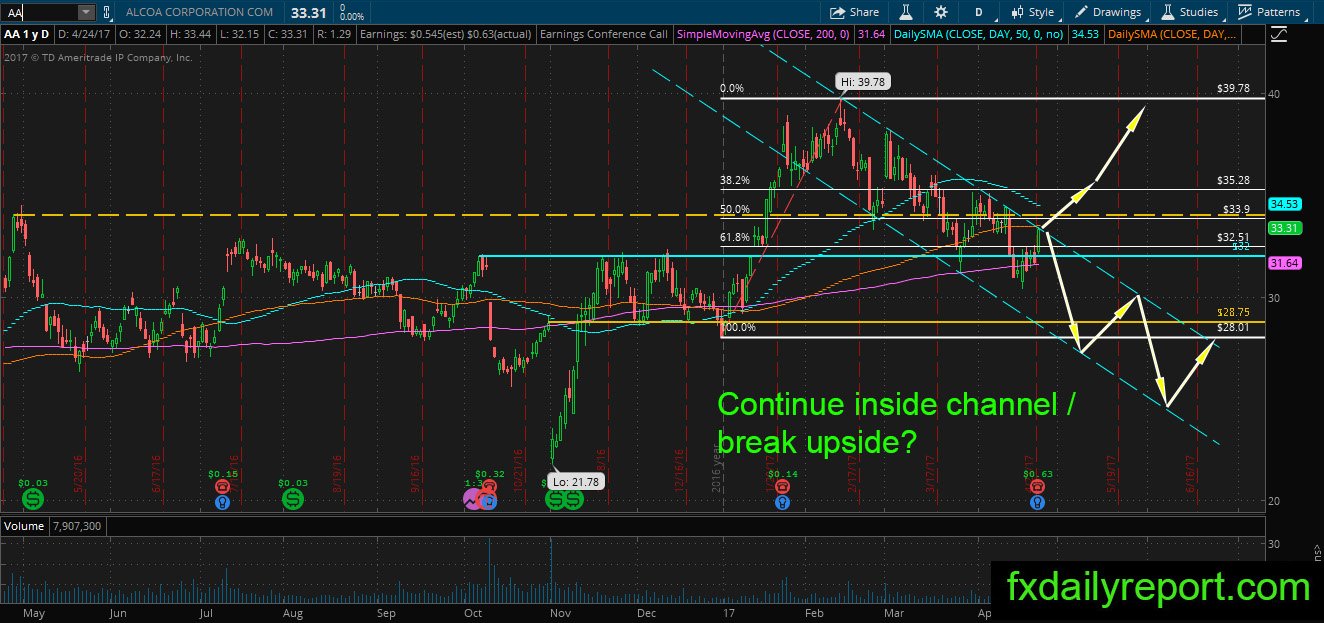
AA is moving up after the earnings report, and the price touched its top of downtrend channel. It might bounce lower from the current level and continue moving inside its bearish channel. However, the upward momentum from earnings report was strong which might continue breaking upside.
Danaher Corp (DHR)
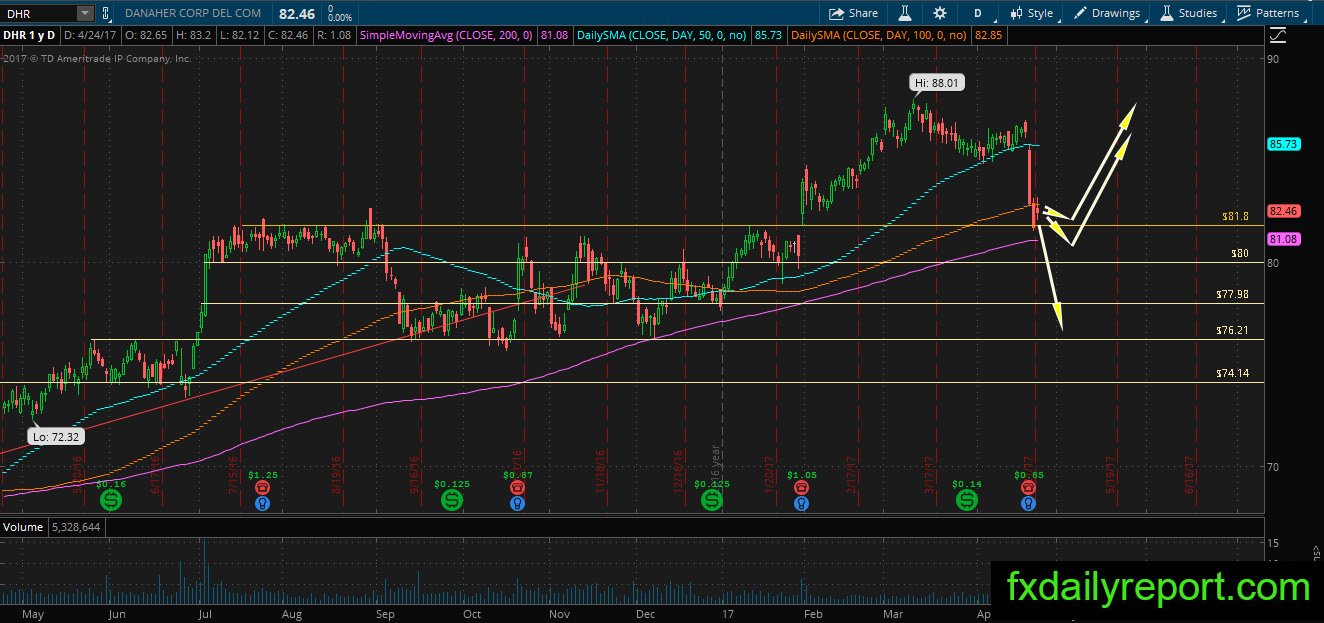
The sudden drop happened in DHR share prices despite earnings and revenue beats. The share price might continue its downward movement, but at the current level, it is a good level to look for a long position. DHR has support at daily SMA 200 and horizontal support $81.80. If the bull manages to hold the selling pressure, it might start turning up.
Other Watchlist
HOG – the daily share price hit SMA 200, might find support there.
JWN – the price approach its daily SMA 200 from below, might bounce lower.