
Cranking down the buying momentum
The gain in oil price drive Wallstreet up on Wednesday, the market successfully move higher but failed to maintain its gain. Dow Jones, Nasdaq, and S&P500 all relinquished the gain in early trading and closed lower. Upward momentum still strong but traders might be aware of the risk in holding position longer before job news.
Today we might see profit taking in the market and the period of preparation before the interest-rate announcement in the middle of December.
Technical Analysis
Dow Jones Industrial Averages (INDU)

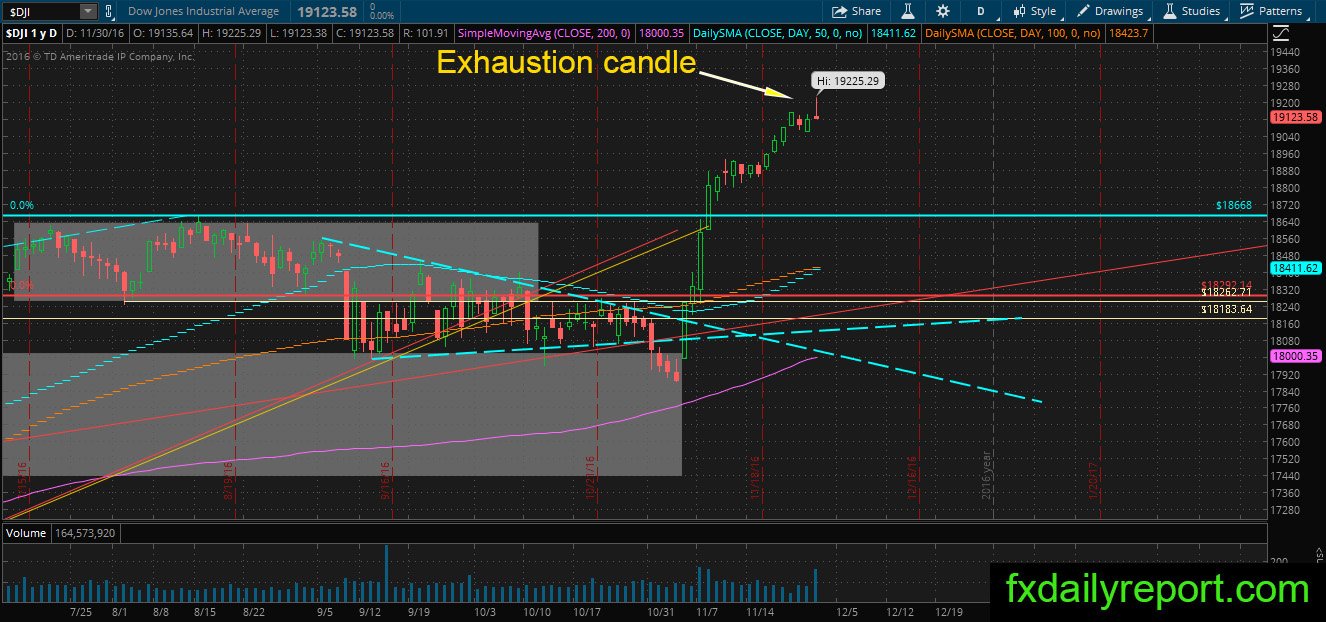
Dow Jones marvelously attain new high with each day, but this upward momentum might come to an end as Yesterday the index formed exhaustion candlestick. The candle relatively small, but if confirmed, it will reverse the trend. We have 18,668 and 19,000 as support when the price reverse.
McDonald (MCD)
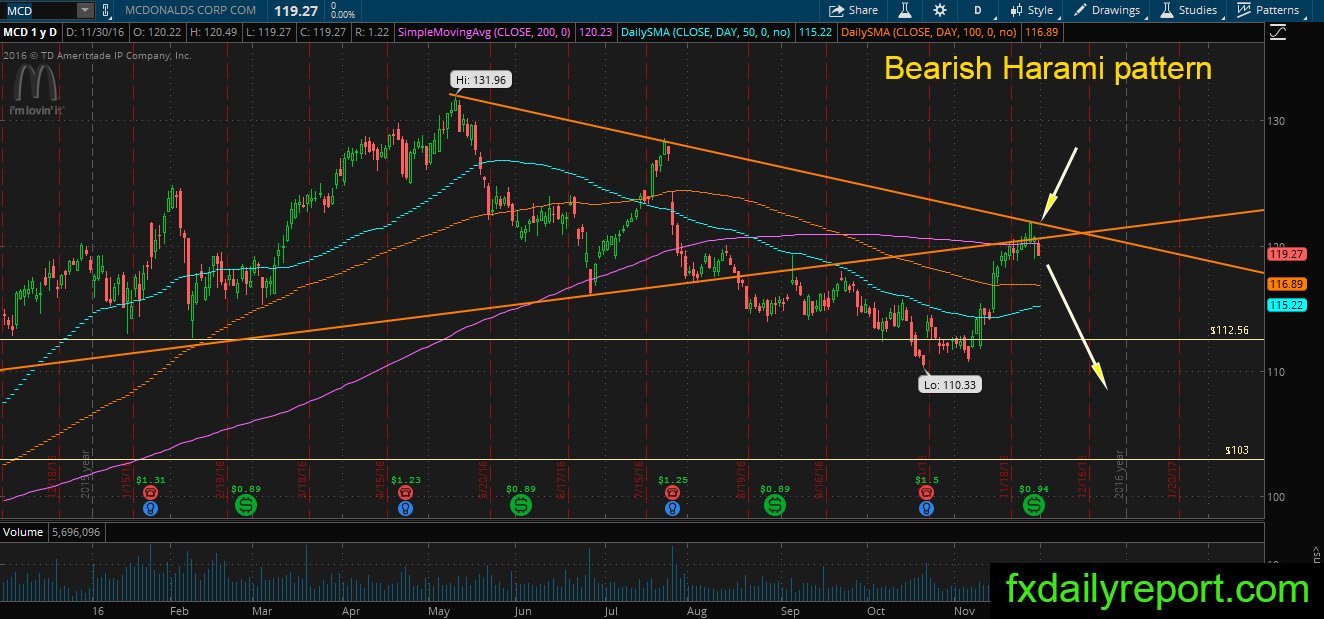
Rally in MCD face roadblock as the price formed bearish pattern near its daily SMA 200. If the price closed lower today, we might see a continuation of the bearish trend.
Ralph Lauren (RL)
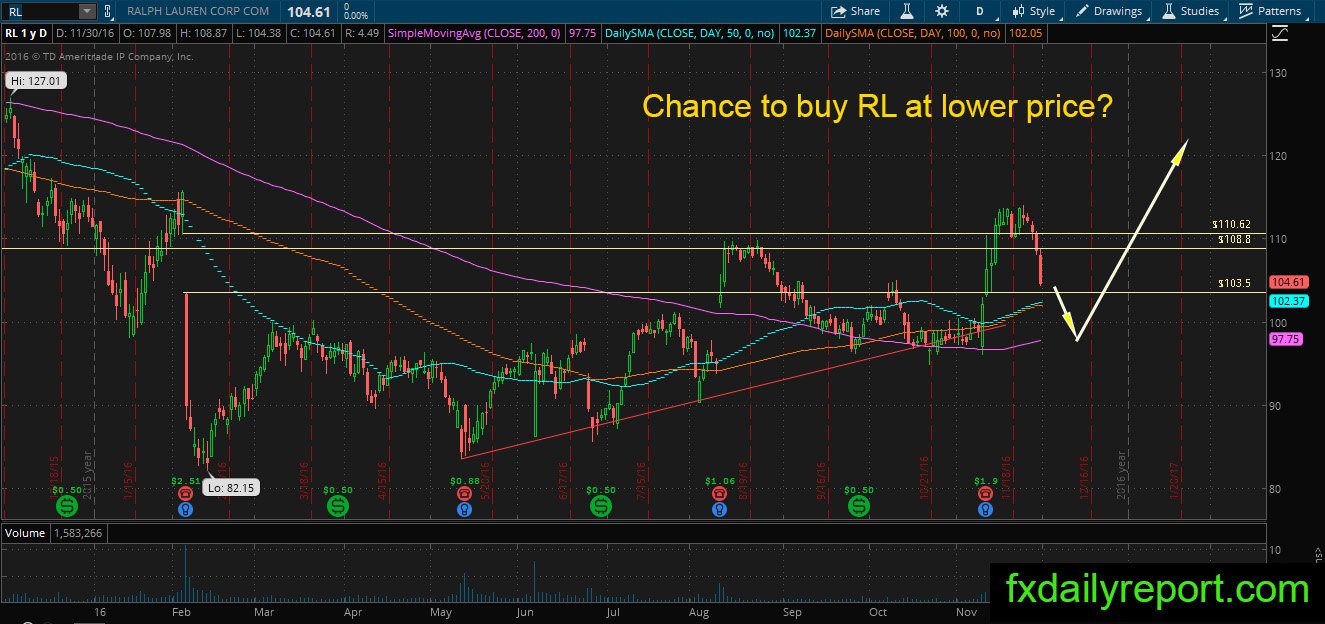
RL bounced from its SMA 200 and printer higher high, the price aggressively sold as shown by three candle decline. The decline is gaining momentum each day which is not good for the bull, but RL is near SMA 50 & 100. There is a chance the price will reverse at the averages, and traders need to wait until bullish pattern emerge before taking a position.
Other Watchlist
UTX – a bearish engulfing pattern formed when the price reached a new high, possible reversal at the top.
V – A break and close below daily SMA 200, more selling expected.
KO – referring to the 25 November long-term analysis, KO is near the long-term trendline, and if a bullish pattern emerges, it will be ready for a reversal.
MO – we have waited for a bearish pattern to form in the share, and we have the bearish engulfing pattern from the daily SMA 200 which is a good indication of reversal.