
The Fed blew the party
The interest-rate increase button pressed by the Fed, but Wallstreet reaction is opposite to what expected. This is due to all factor already priced in, except that the Fed plan for an aggressive interest-rate increase next year, up to three times.
Wallstreet might perceive next year outlook as positive, but decide to take the profit out of the table as a rate increase commonly negative for shares. Three rate-increase soon is not a good sign for the stock market, but the global market weakness and Trumponomic uncertainties, in the end, boost upward speculation.

Today, Wallstreet might avoid selling as the Dow Jones Industrial Averages Futures show a hefty gain of 41 points before market open. The index ready to target the 20,000 mark.
Technical Analysis
Dow Jones Industrial Averages (INDU)
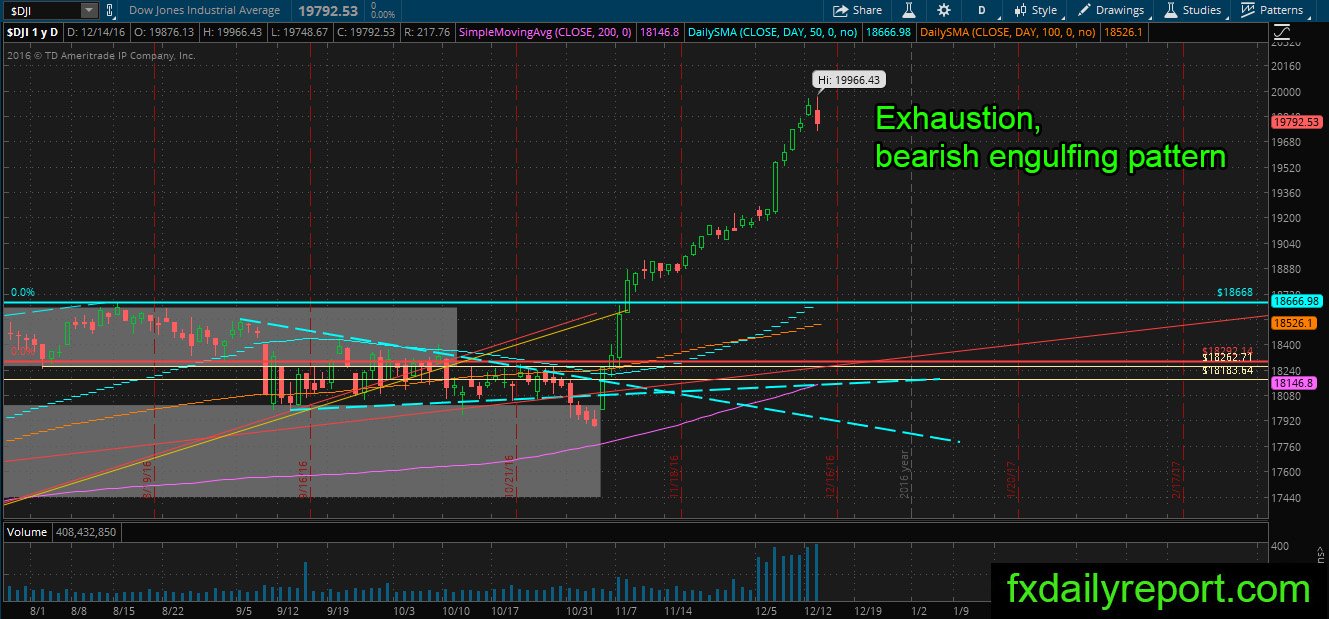
Close, really close. Dow Jones Industrial Averages sideway and positive before the Fed interest rate announcement. However, as soon as the news was released, the index took a dive and stay lower until the close of market.
The movement result in a bearish engulfing candlestick with high at 19,966, just 34 points shy from 20,000. Maybe the bear will think it is the time to start selling, but history proves when the target is near, no one can stop the market. We think the bearish engulfing pattern is a bluff and the bull will blow it away.
Dollar Tree (DLTR)
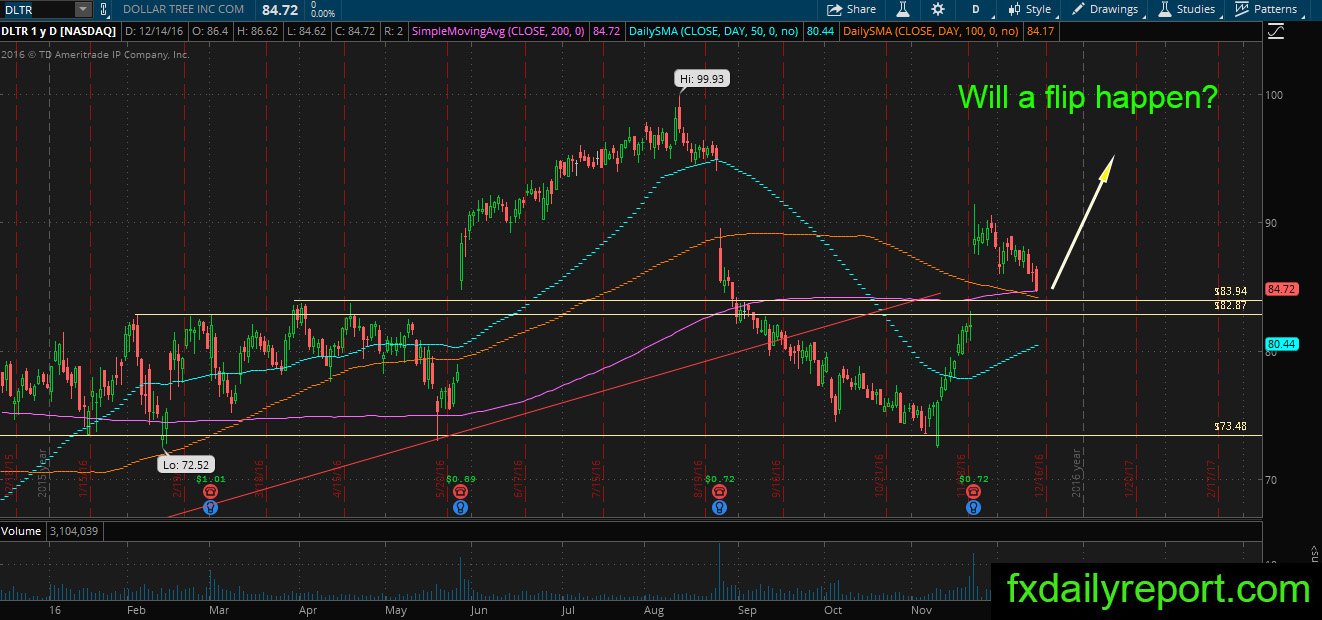
No bullish indication yet from DLTR. But it is worth to watch as the price fall back near the major S-R also the daily SMA 200. If the price can bounce and form a bullish pattern, DLTR will continue its recent bullish trend.
Exxon Mobil (XOM)

XOM looks to reverse the current upward trend and make a correction. The price might fall toward the box area, and if it can maintain the position above the area, there is a possibility the price will continue to move upward.
Johnson & Johnson (JNJ)

JNJ formed a bearish engulfing candlestick as it re-test the daily SMA 200. This is not a good sign for the bull, and it needs to close higher above the SMA 200 to cancel the bearish outlook. SMA 100 has not crossed down below SMA 200 yet which is neutral. But once the SMA crossed down, we will have a new long-term bearish trend.
Other Watchlist
WMT – bearish engulfing near the top of trendline (Triangle pattern) as shown in our December analysis
VZ – a Bearish engulfing pattern formed at the daily SMA 200.
HON – bearish engulfing from the top of $110 – $118 range.
DUK – possible bearish continuation after a bearish engulfing pattern from SMA 50.
PM – bearish engulfing from the daily SMA 50
PG – bearish engulfing near its daily SMA 200, possible to turn into a bearish continuation.