
Pause before job data
Today the market is waiting for Non-farm employment data release on 8.30 AM. Better than expected reading will set more bull into the market, while a worse than expected reading is not expected and could reverse the course of market sharply.
Though the news today is important, the rate increase in this month FOMC meeting already priced in and will give minimum influence. In another market, crude oil price continues its advance after production cut gets green light, the market rejoicing this production cut but successful implementation stays the main issue.

Do not forget Italy referendum will be hold on Sunday. Although it is not major news, it might influence future possible Itaxit.
Technical Analysis
Dow Jones Industrial Averages (INDU)
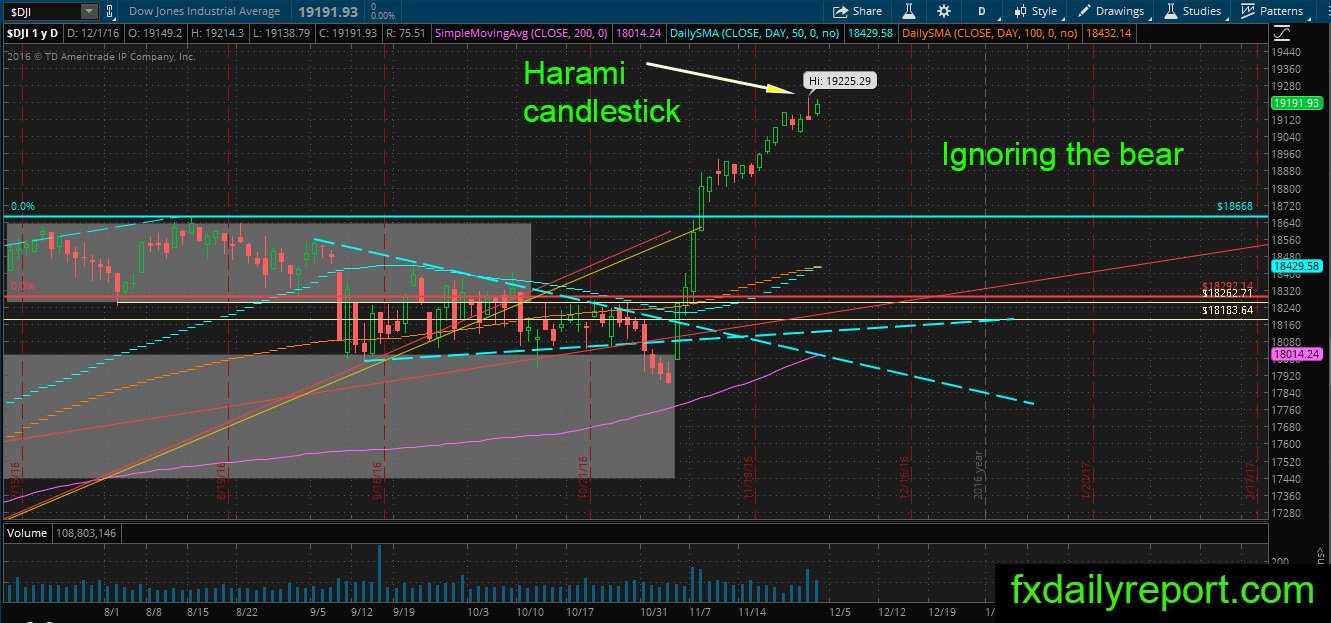
The bull is clearly ignoring the bear. Dow Jones Industrial Averages keep pushing up without stop and leaving the bear no option to reverse the momentum.
Hasbro Inc (HAS)
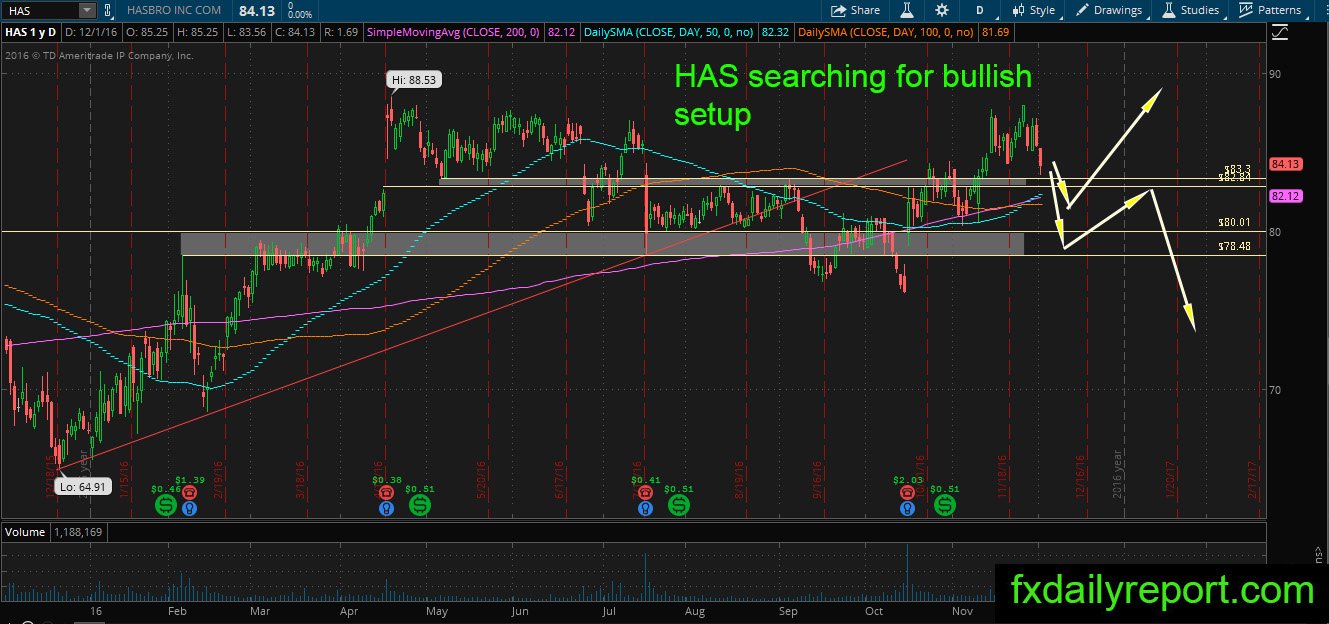
Rally in HAS fizzled before reaching a new high, and the price is searching for bullish setup near the horizontal S-R & daily averages. The level between $82 – $82.50 might provide support; Otherwise, it will enter bearish trend.
Schlumberger (SLB)
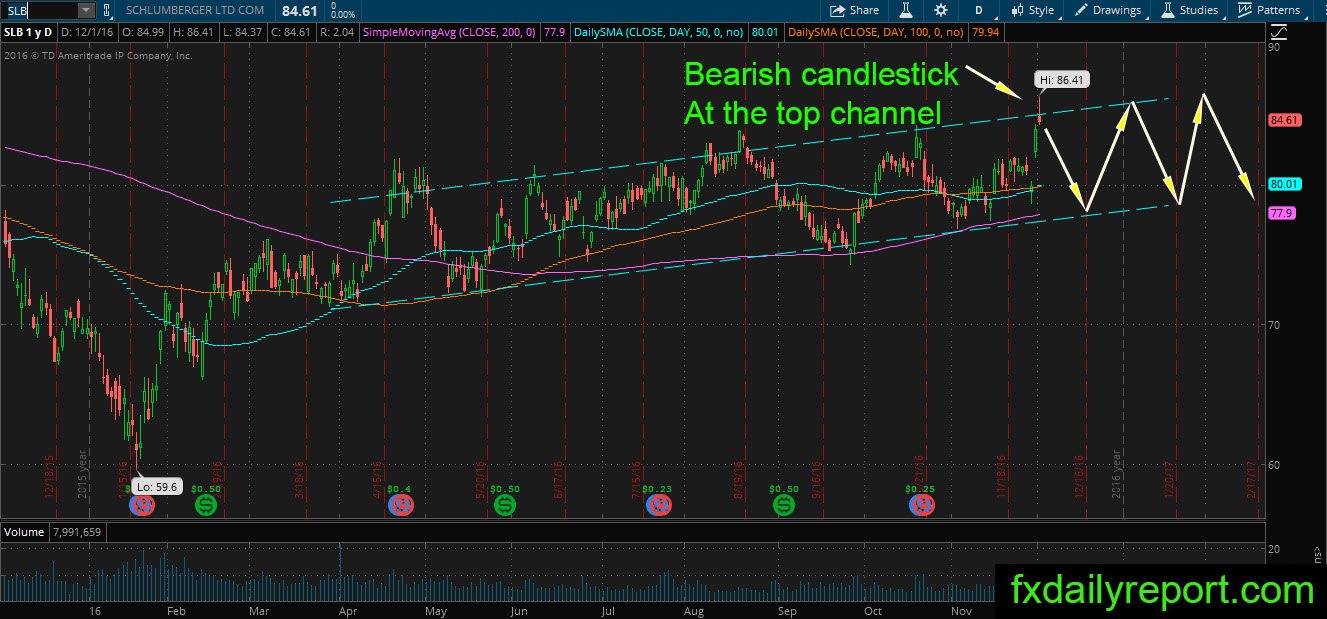
SLB bounced from its lower part channel and reached upper part of the channel. Currently, the price formed bearish candlestick which sign reversal. Traders can use this chance to place short position and ride the wave toward the lower part of the channel. As long as the price stay inside, no change to the channel trend.
Other Watchlist
LOW – SMA 50 flip, a bullish opportunity toward SMA 100 & 200.
WDC – long bearish engulfing pattern, might indicate a reversal.
TOL – observe bounce from cluster of averages (50,100, & 200)
QCOM – more weakness after massive drop, it might continue toward $58 – $60
ORLY – flip above SMA 200 and also the sector bullishness will help share price up.
PYPL – slip below SMA 200, it will continue lower toward $37.50