
Another bullish stamp
Wednesday European and the Asian market are positive in anticipation of Thursday ECB announcement. Nikkei, Australian ASX 200 and Shanghai Composite gained 0.74%, 0.91%, and 0.70% respectively. ECB predicted will prolong its asset purchase program up to 6 months.
Wallstreet futures also positive with Dow Jones Industrial Averages futures posted 25 points gain. No major economic data release today, the market expected to continue its upward movement.
Technical Analysis
Dow Jones Industrial Averages (INDU)


Similar to the previous day, the index continues its upward movement. However, there is one thing to note: The volume of transaction spiked 3-4 times normal, this is an unusual event, and there are several perceptions:
- Profit taking ongoing, traders and investors locking profit, this is distribution period and could lead to a reversal of trend.
- The short seller is closing their position; this is positive as it means the resistance chipped.
Observing the price movement, it might be the second possibility as the price gapped up and hitting stop losses before turning up again.
Danaher (DHR)
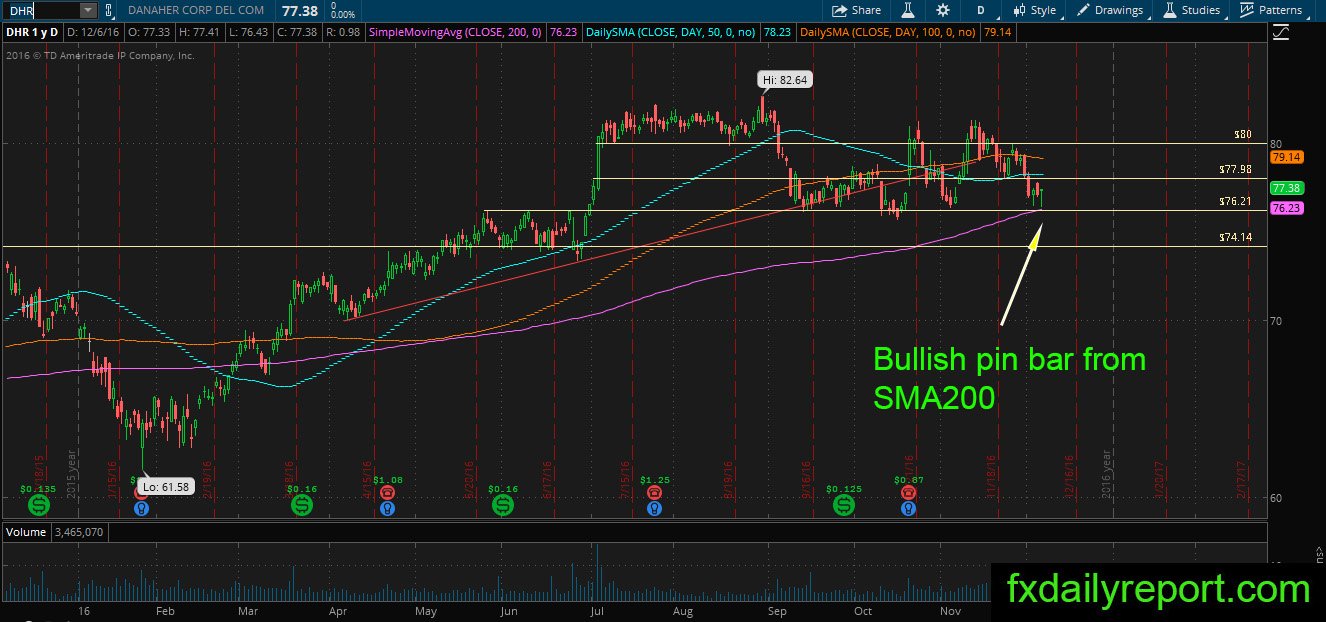
Bullish engulfing pattern from the daily SMA 200 put DHR into another attempt to stay bullish. The price is under pressure after recent selling by the bear. It need to stay above the SMA 200; otherwise, we will see massive sell-off below the averages.
Expedia (EXPE)
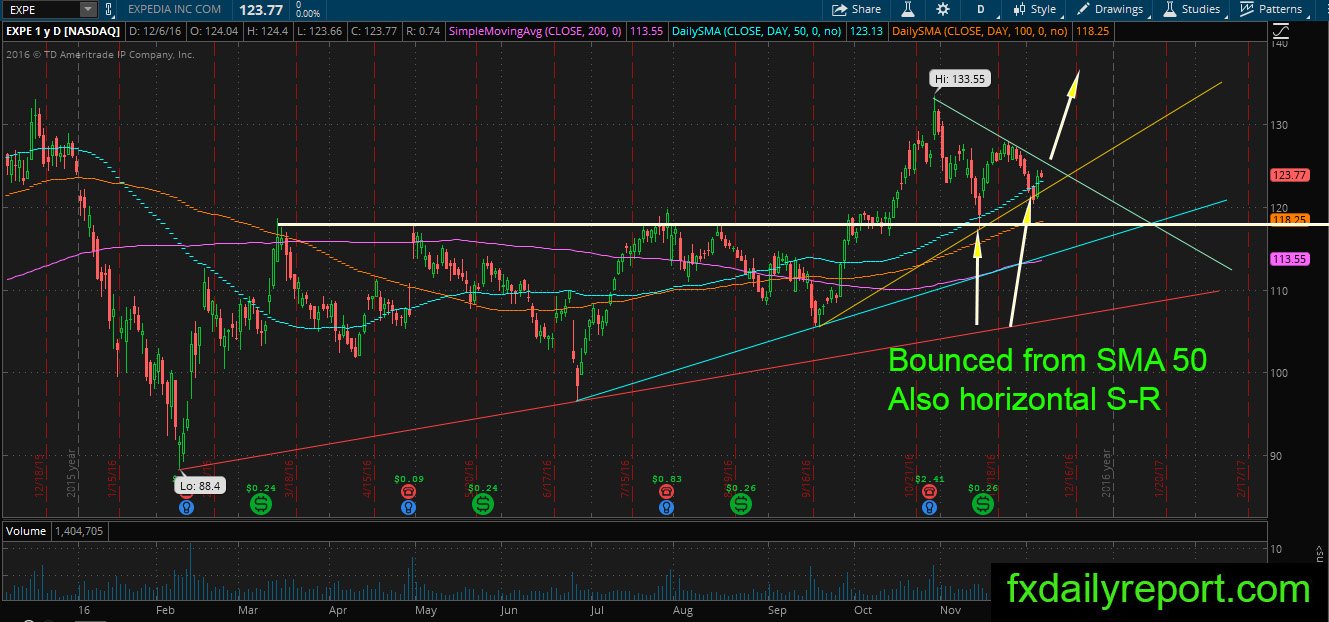
Triangle pattern formed on the EXPE chart. Previously the price bounced from confluences of SMA 50 and horizontal S-R at $119 – $120. Currently, the stock moving inside triangle consolidation, will it continue the upward movement? Alternatively, will it break lower and retrace to the daily SMA 200?
Other Watchlist
ADM – $45 gap filled, watch price action near the gap area.
BSBR – bounce from SMA 50, possible continuation.
ADBE – bounce from SMA 200, not a strong rebound and might experience more selling.
MMM – the price is consolidating near SMA 50 & 200. Both SMA made dead cross which is bearish. If the price bounces up from this level, it will cancel bearish outlook.