
Will the “Trump” inspired rally stop?
U.S stock market is bullish and extremely bullish with all major indices gaining. Today before market open the Dow Jones Industrial Averages Futures gained 15 points which indicate more upside. Some analyst said this rally would not stop until it reaches 20,000 in the Dow Jones, and it probably will become true as the index just 386 points shy from the psychological level.
ECB stance in the previous day also might start an end of a low-interest-rate era, and the central bank is slowly decoupling the asset purchase program. It is expected to join the fed in few years while it is slowly putting out the tapper.

Lack of influential news today will let the bull control the market once again. The only major news today is the Prelim UoM Consumer Sentiment with an estimate of 94.3 in the reading.
Technical Analysis
Dow Jones Industrial Averages (INDU)
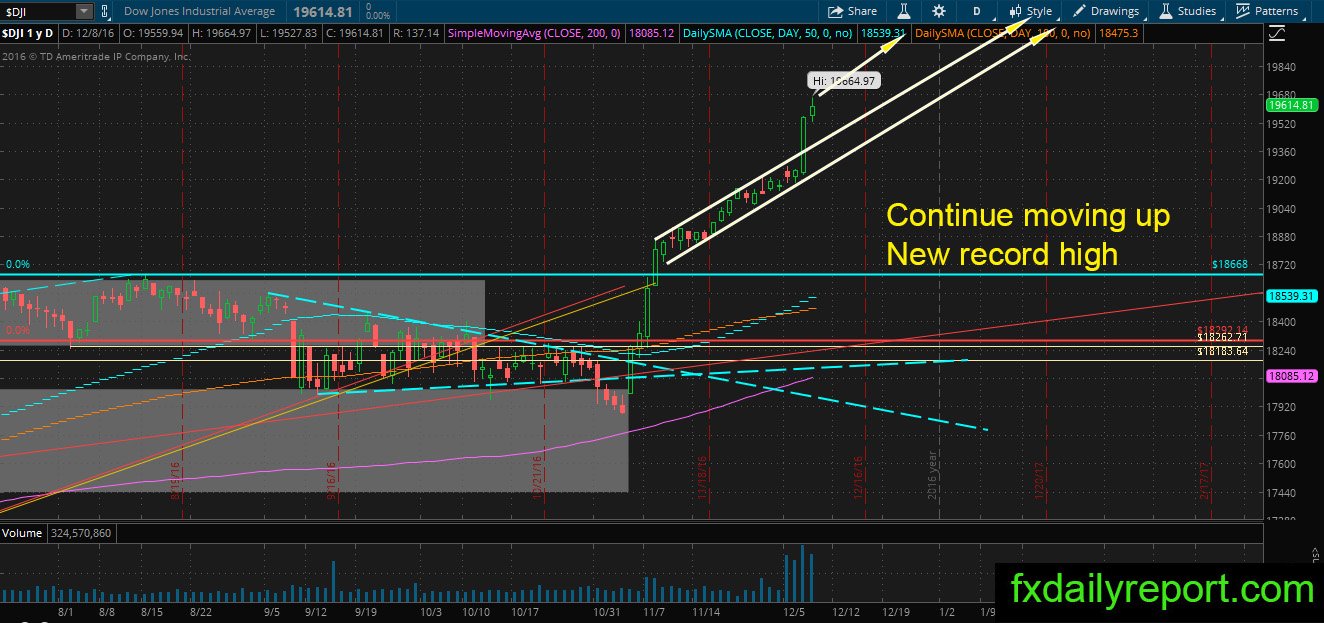
New record high printed in the Dow jones Industrial Averages. The index shows no intention to turn down and keep charging without stop. The volume of the transaction also tripled than usual daily volume, no change in the stance, let the market play it out until it exhausted.
Las Vegas Sands (LVS)
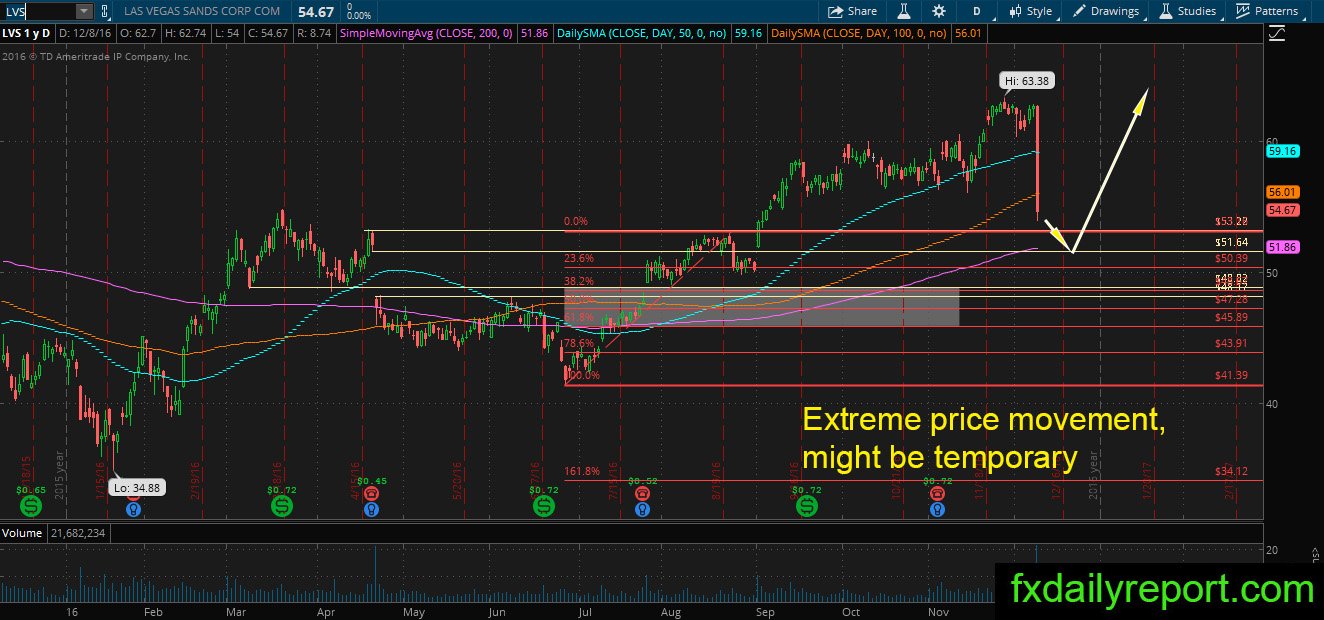
The extreme drop in LVS price mostly influenced by the fundamental news coming from Macau. There is a news release about daily cash withdrawal limit from 10,000 patacas ($1,251) to 5,000 patacas ($626). Macau denied the daily withdrawal limit and cited the 5,000 patacas withdrawal limit is only for one transaction, the daily withdrawal limit stays at 10,000 patacas, Full news release can be read here.
Though there is ongoing confirmation on the cash withdrawal. LVS is in a bullish trend, and the extreme drop in share prices provide traders with a good chance to take a long position at the lower level. Traders need to observe price reacted at support, especially the daily SMA 200.
Other Watchlist
ORLY – Gap closed, the price retrace down and closed as a bearish engulfing pattern. The price might move lower toward SMA 200 and produce an opportunity for the long position.
YELP – bullish pin bar at the support level, not a strong indication but might produce bullish movement.