
Further into uncharted territory
Dow Jones Industrial Averages finally break above 20,000 this week, the break expected and followed by the realization of President Trump controversial promises before he enters the office. President Trump signed executive order to start building border walls between U.S and Mexico. Also, there is an idea to impose 20% import tax on goods purchased from Mexico.
Automobiles, engines and parts companies will benefit the most from this policies if implemented. However, there might be another trouble formed over illegal immigration.

Nevertheless, Wallstreet currently concentrated on short-term view and might adjust to long-term view later. More protectionist policies should be introduced in coming weeks and months.
Technical Analysis
Dow Jones Industrial Averages (INDU)
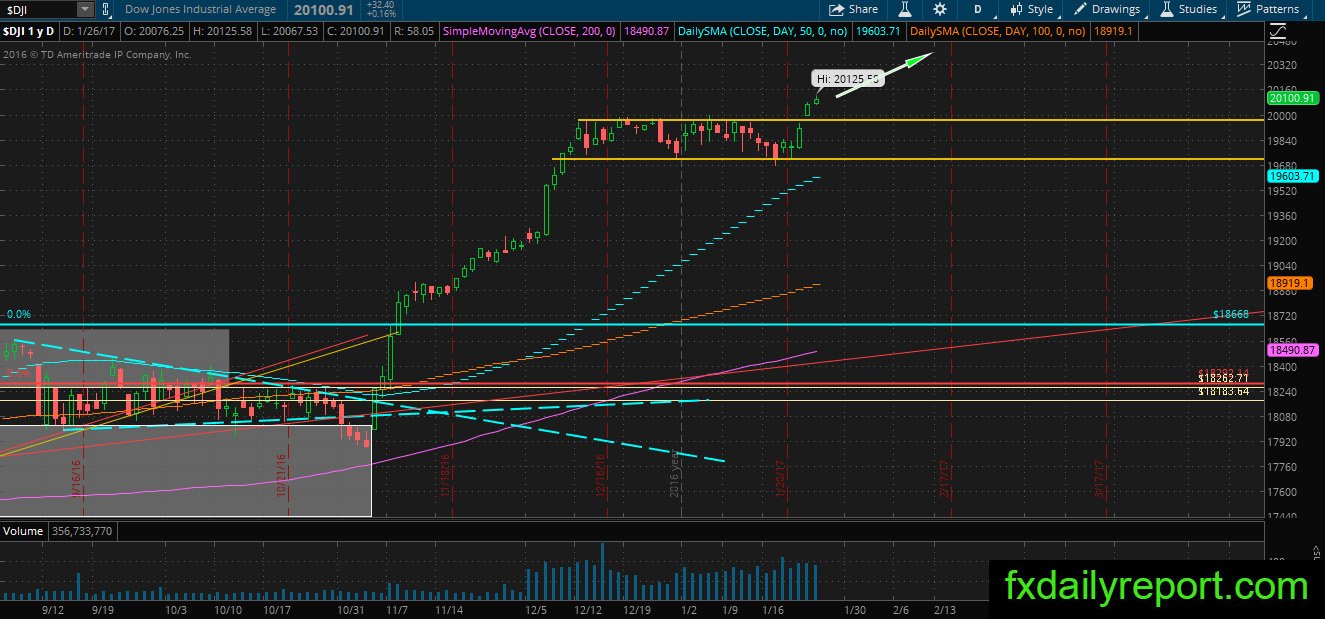
Dow Jones Industrial Averages continue its up move after it close above 20,000. Although it closed triple digit above the 20,000 handle, it might not be enough to maintain bullish pressure. The next question to ask is, “Who buy the break of 20,000?”. Is it retail investor? or is it the professional investor?
Judging the break of 20,000, it looks like the break caused by retail investor and will not last long unless the professional trader decides to push the index 200-300 points further.
American Tower Corp (AMT)
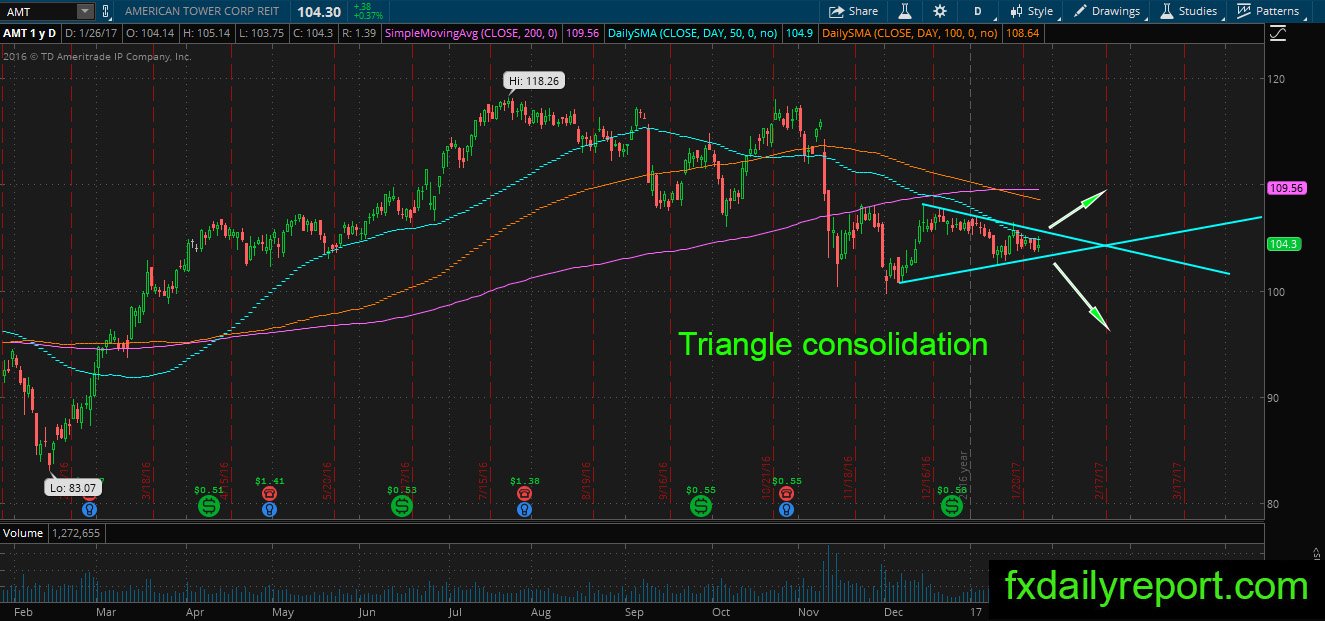
One consolidation to watch is triangle consolidation in AMT. The consolidation happened after the price unable to maintain its position above daily SMA 200. A close lower is favored, as the trend is bearish.
Antero Resources (AR)
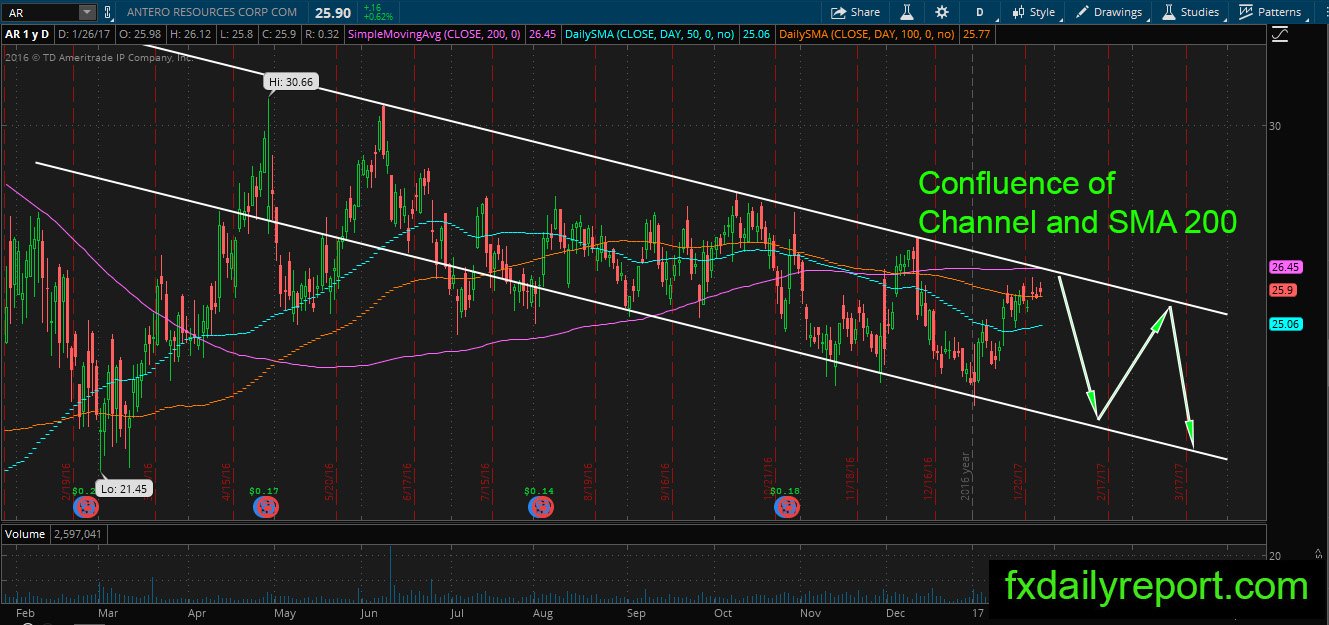
AR move in a bearish manner inside its bearish channel almost for one year. The share price bounce from its bottom channel and currently drifting just below its upper channel and daily SMA 200. There are high odds the share price will continue moving inside its bearish channel and provide a chance for the short position.
Other Watchlist
WYNN – bearish pin bar after worse than expected earnings, might continue lower as LVS stock in the same sector already moves down sharply.
HAS – The stop gapped down, observe how it react at $78.5 – $80 support area.
ADBE – Bearish engulfing Candlestick after it reaches new 1-year high, possible temporary setback.
VET – The price near its daily SMA 50.
CVLT – Worse than expected earnings put the stock down near its daily SMA 200, might not bounce from the averages.