
Bearish roll for U.S stock market
U.S stock market ripe for a correction, all three major indices slide more than 1% in the previous trading session, and the indices futures show further correction today. Dow Jones Industrial Averages futures down 33 points before market open. As there are no major news releases today, traders could expect the bearish trend will continue.
Major indices in Asian stock market and European market tumbled following the decline of U.S stock indices. The decline might accelerate this week and brought most indices lower 5-10% from the top. It is better for the bull trader to stay sideline under current situation and to scale out of position.
Technical Analysis
Dow Jones Industrial Averages (INDU)

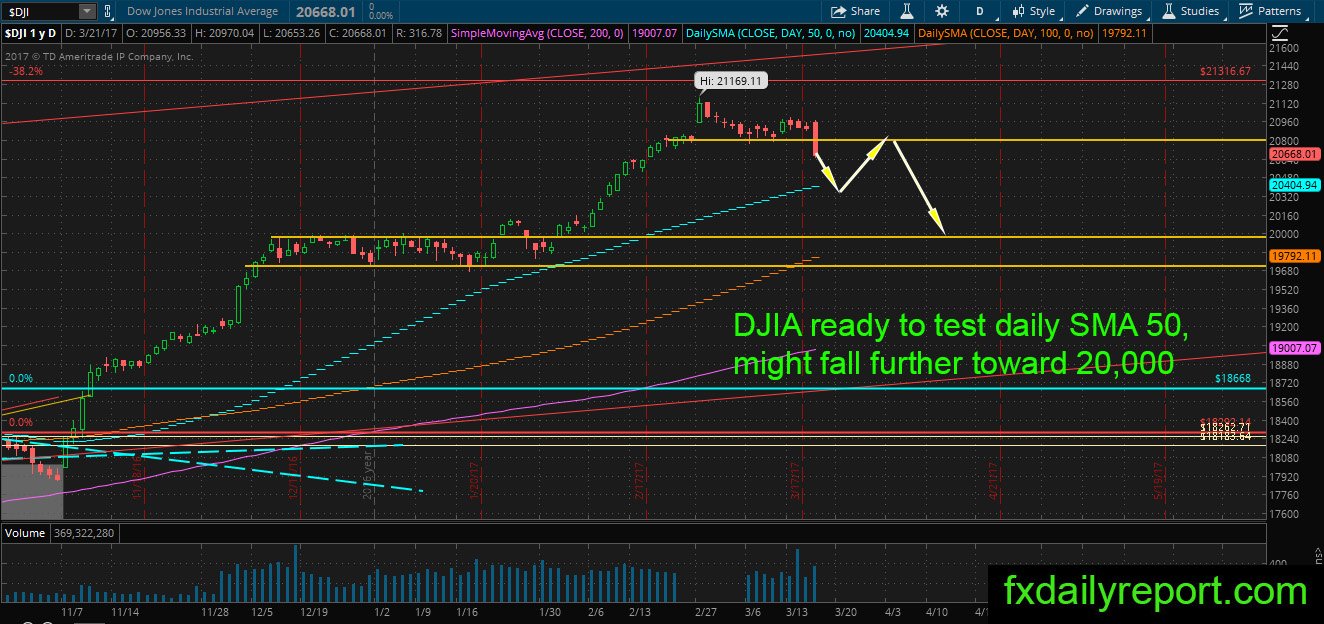
No escape for the bull after the index slide below 20,800. It is ready to challenge the daily SMA 50 and might fall further toward 20,000 handles. The bull might want to stay sidelined at least until the index reaches either daily SMA 50 or the 20,000 handle.
Quintiles IMS Holdings (Q)
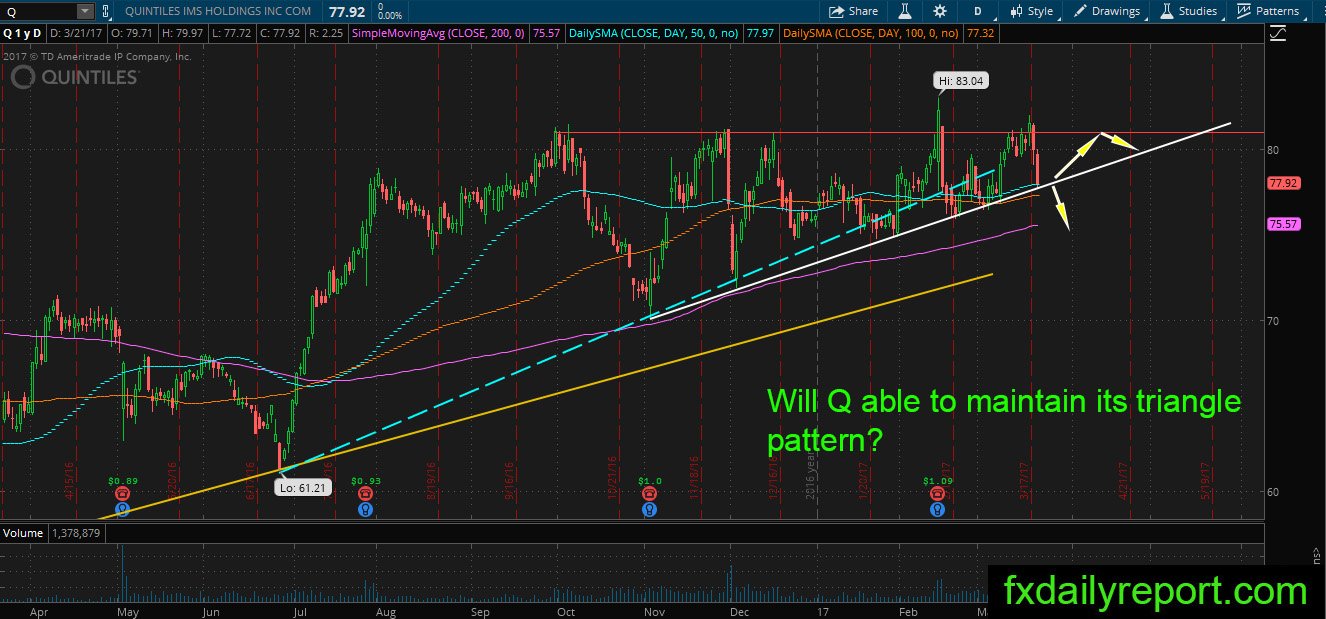
Ascending triangle pattern in Q has not broken yet. The price fell sharply from the top and currently stick near the bottom of the triangle. Will Q able to maintain its triangle pattern and bounce higher or will it break lower and test the daily SMA 200?
Other Watchlist
AAPL – Bearish engulfing pattern formed at record high
PYPL, CAT, DD, CSCO, HAS, ATVI formed a bearish engulfing pattern. Similar pattern in most shares might indicate strong trend under progress.
SBUX – Possible continuation lower after the price formed bearish engulfing pattern near its averages resistance.
KO – the price reached its daily SMA 200, might bounce lower.