
Flat day ahead before Yellen testimony
The futures move cautiously all day as the market will hear Janet Yellen testimony before Congress today. The market will take note on several issues revolving around December interest rate hike, how Trumponomics affect the economy next year, Fed stance toward new administration, The Fed outlook on inflation and interest rate next year.
Many might already priced in rate-hike next month which put the news less influence. What the market want to see might be how the Fed able to support the Trumponomic and stay independent.

Earlier today, Bank of Japan surprised the market with its new policy to buy an unlimited amount of government bond at fixed rate. This measures taken to tame recent bond yield spike caused by Trump effect and expected to weaken Yen.
Technical Analysis
Dow Jones Industrial Averages (INDU)
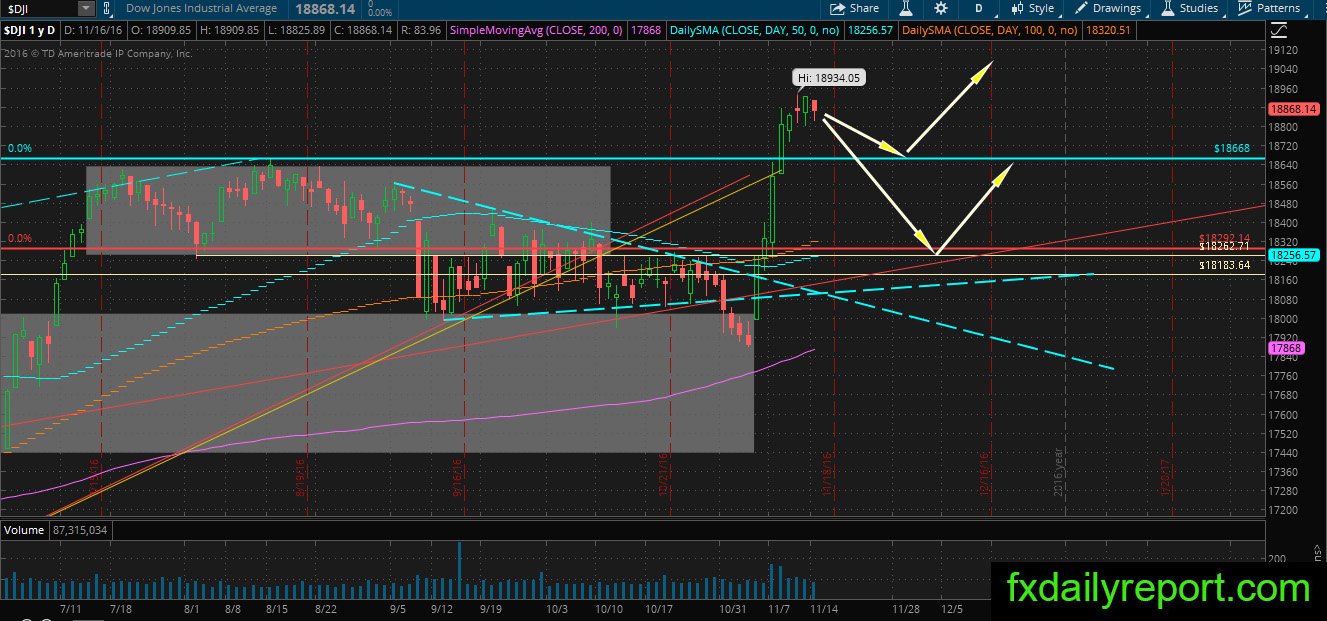
Harami candlestick pattern formed at the top, will Dow Jones Industrial Averages stop the bullish sentiment and enter correction? If the price move down, it will find support at 18,668.
Dow Jones Industrial Averages Futures flat at -2 points before market open which indicate more sideway movement at the top.
Activision Blizzard (ATVI)
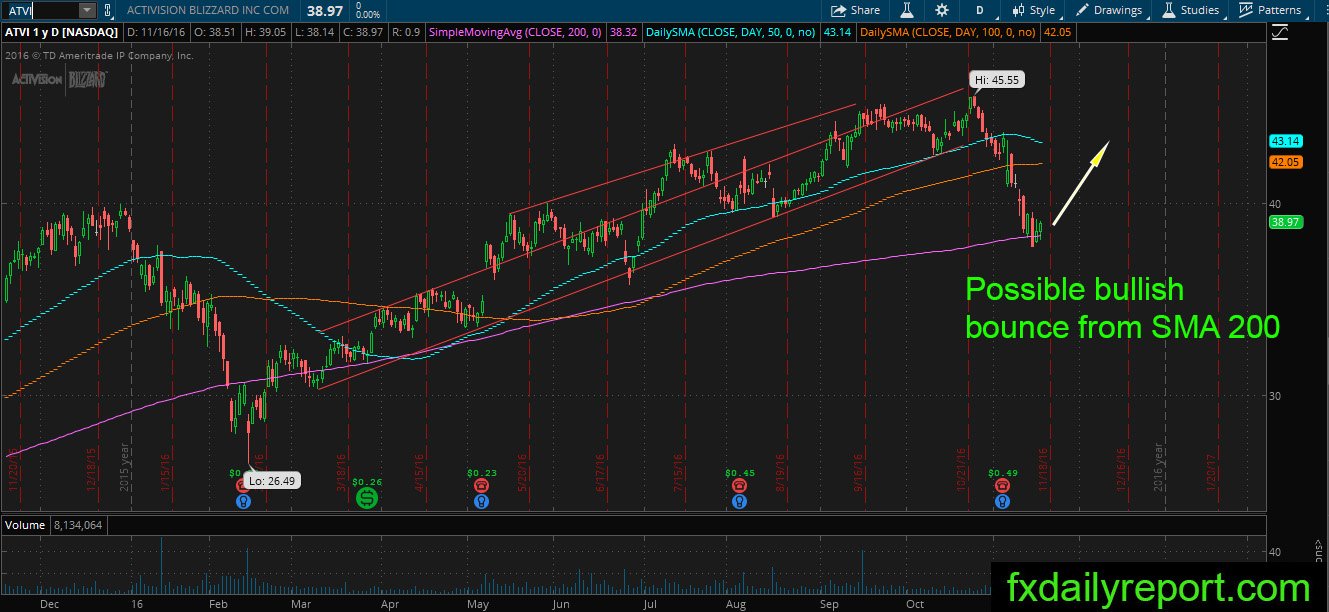
Tech topple which happened after election result out might be a little bit overdone. The market punishes all shares which might have trouble when Trump get into the office. There are discussions on how the President will not be able to implement all his campaign promises, especially on the NAFTA.
Nevertheless, ATVI is one of the technology stock which perform well on the fundamental side, it currently near the daily SMA 200 and possible to stage a rally when the market normalizes.
Netflix (NFLX)
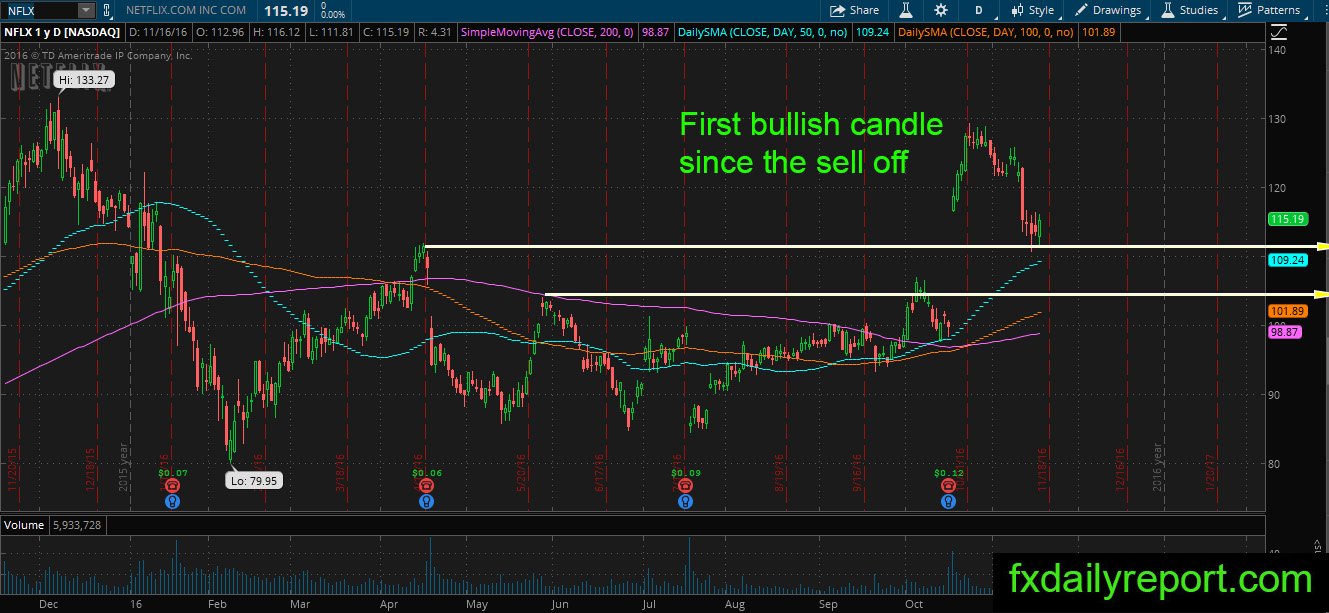
Another star of this year, NFLX which reported explode in its subscription worldwide. The price fell near its SMA 50 and also the horizontal support level. Bullish candlestick formed near the level and might provide a chance for the share price to bounce up.
Other Watchlist
KR – the price reached SMA 200 and formed bearish candlestick pattern.