
End of a rally?
Two weeks ago, Dow Jones Industrial Averages gained 853 points and closed above $18,668 resistance. The price has been sideway in the previous week with just 128 points movement. The market seems hesitant to drive the price higher, but it also reluctant to give up all the gains.
This week we might see the continuation of sideway movement as the market participant will celebrate Thanksgiving this week. The next question is, will we have Santa Claus rally again as usual? The market statistically anticipated the rally and this time the moment just right after the breakout above previous record high.
Technical Analysis
Dow Jones Industrial Averages (INDU)

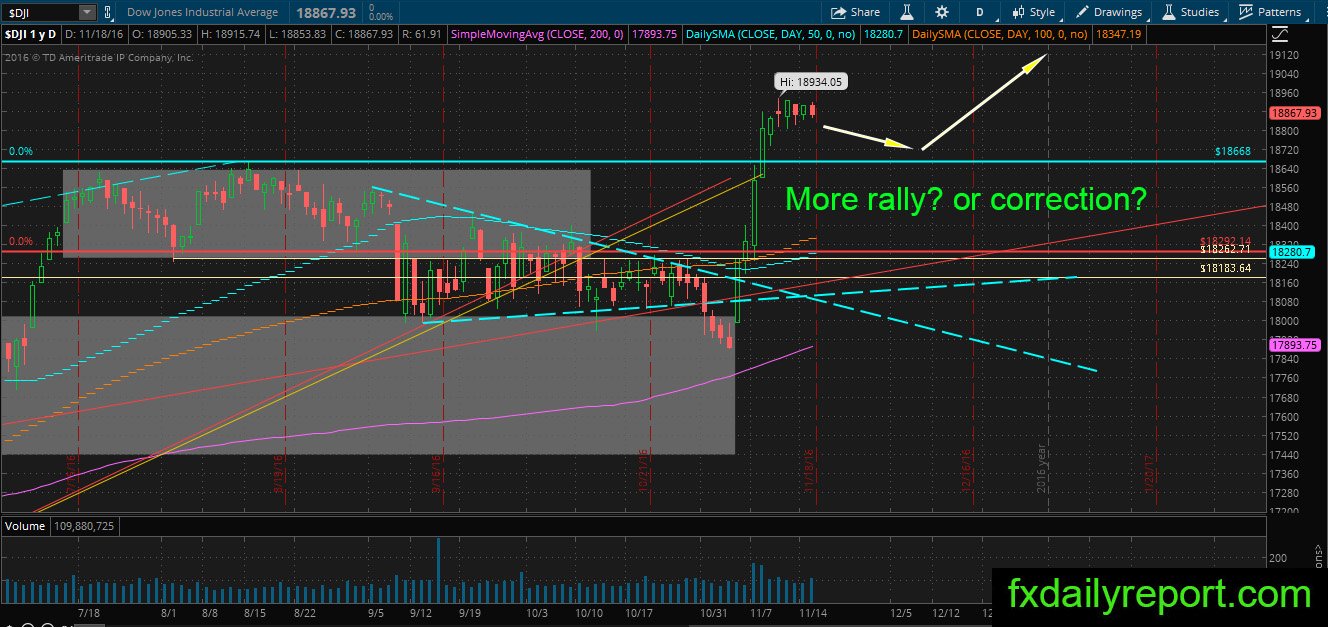
The sideway movement continues, and the price range gets tighter each day. We can expect direction candle formed soon, however, under current situation just wait and see.
General Motor (GM)
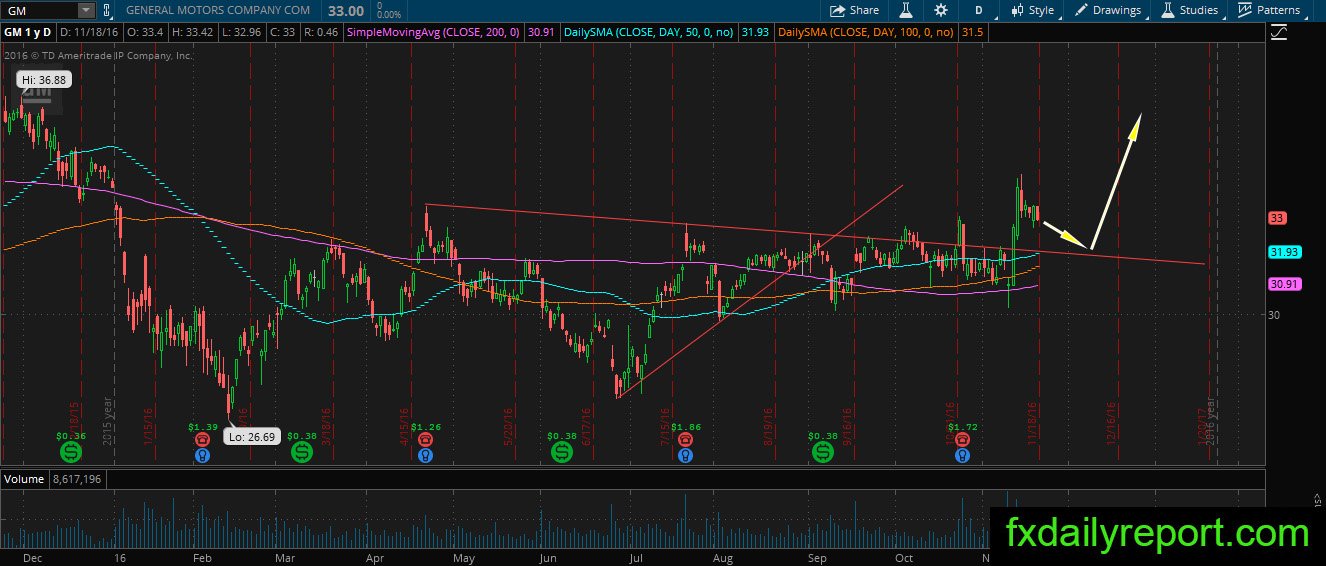
One of the companies which will benefit from Trumponomic is GM, the share price jumped above its trendline resistance and made a higher high. This indicates more bullish movement in the future. The best long position could be taken from the broken trendline. A price break lower than daily SMA 200 will cancel the bullish outlook.
Tiffany & Co (TIF)
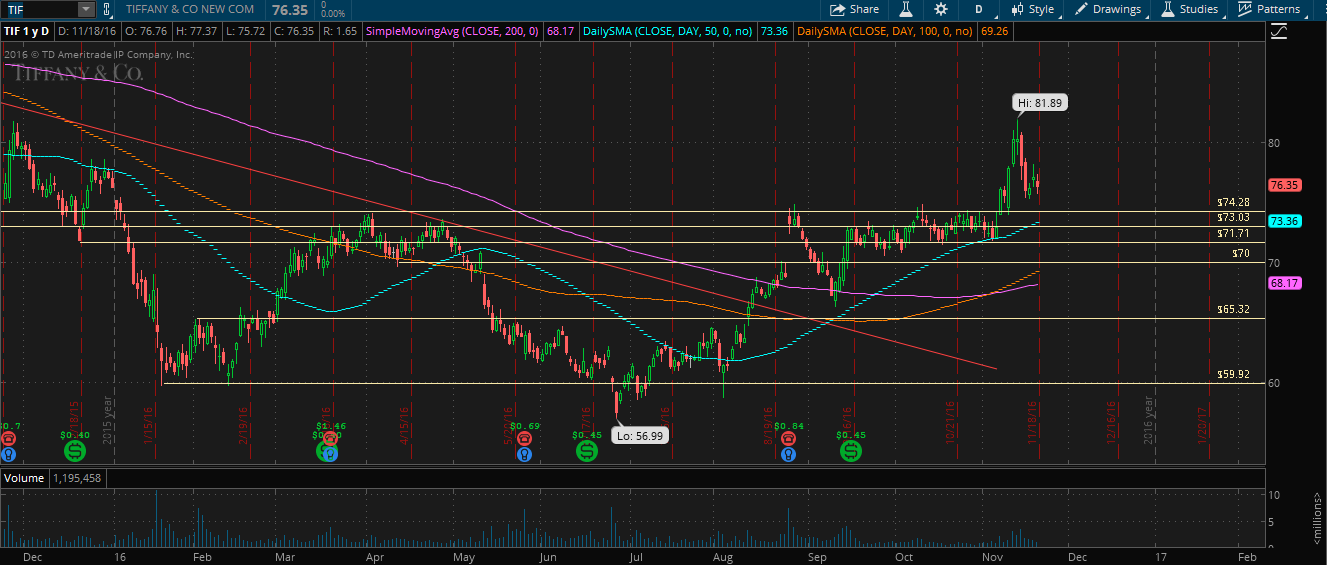
TIF has been bullish since it moves above its daily SMA 200. the price bounce from the SMA 50 and move higher than $74.20 – $75 resistance. Currently, the market looks to make correction and TIF will test $74.20 – $75.00 area which will provide traders with the chance to place long position.
Other Watchlist
F – the price stay below SMA 200, possible chance for a short position.