
DJIA long-term technical analysis
Dow Jones Industrial Averages made it again in October with gain from 22,423 to 23,377 or a 4.25% gain. The index has upper hand in October as the House passed tax-bill budget blueprint. The upward movement also supported by strong earnings reports from companies.
However, the positive sentiment in October hit a roadblock in November. The investigation by special counsel Robert Mueller asks President Trump’s officials to surrender document related to Russia. This will open a probe to President Trump soon.

Another situation to watch is the tax bill, even though House already passed the budget, it will face a hurdle in Senate. The development said discussion focused on “Individual Mandate” which requires all American own health insurance and impose fines if they do not. Republican want to tear this “Mandate” while Democrats want to maintain it.
It will be interesting to see where the index located after issue on Russia probe and tax-bill resolved.
Click here to read previous analysis of DJIA
Monthly chart
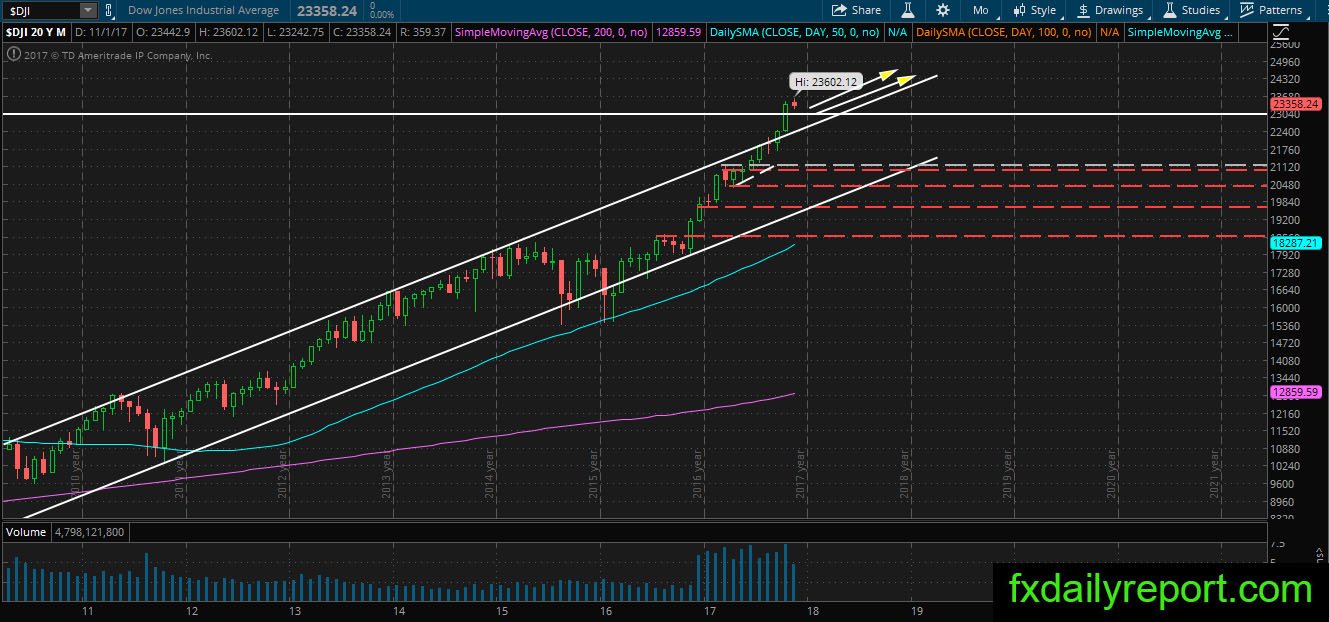
DJIA on the monthly chart sits at the record high and in an uncharted area. The index could either advance higher or reverse down and drop below 23,000. THere is nothing to expect yet at current height, and it is better for traders to stay sideways.
Weekly chart

Similar to the monthly chart analysis, the weekly chart shows no indication of reversal yet. The bull is dominating the market, and the only possible entry for traders is long position near 23,000.
Daily chart
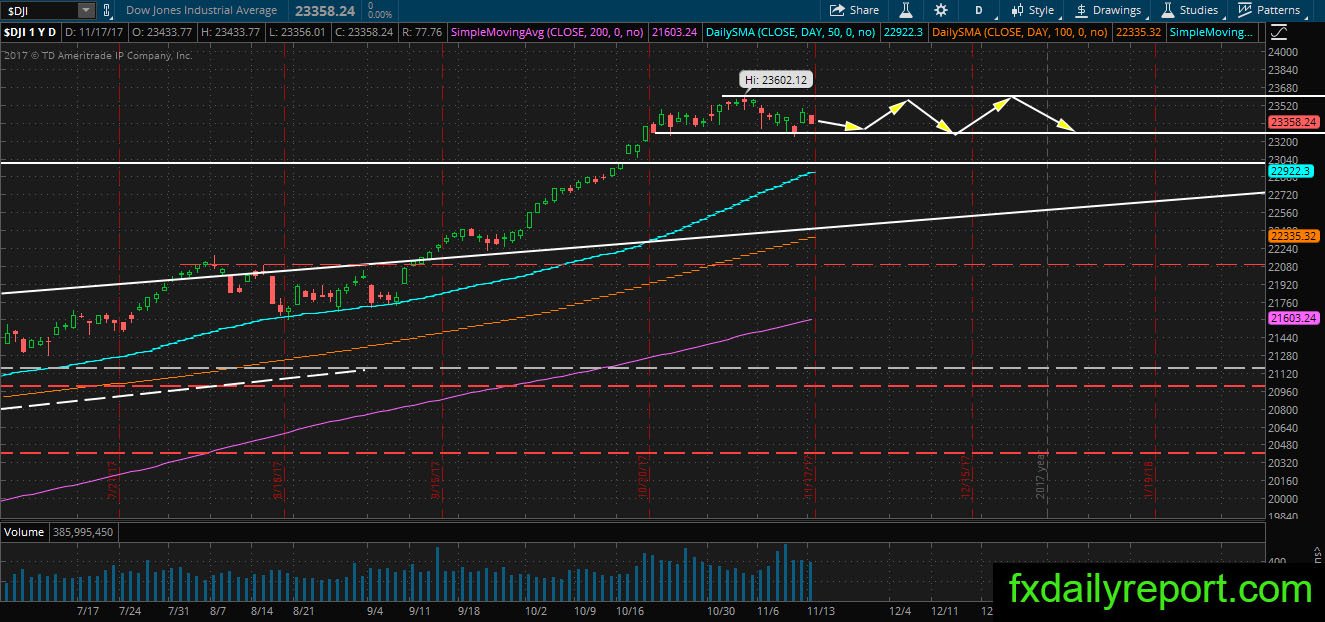
DJIA on the daily chart looks sideways between 23,200 – 23,500. The index looking for direction as fundamental issue weighed on the market. There is news related to Tax-bill and Russia probe which lead to President Trump. The index might move under shaky ground, but the overall the bias is bullish.
Traders could continue bullish on the index as long as it stays above 23,000.