
DJIA long-term technical analysis
The G-20 meeting which kick-off at the end of November is a major event the market wait. In the meeting, President Trump expected to discuss with China’s president Xi Jinping on the trade situation. A successful deal between both countries will weather current trade tension.
Aside from trade issue, the market also observed The Fed stance on interest-rate. Recently, Jerome Powell gave a speech which sounded dovish, confirmed by the release of FOMC meeting minutes. It might be a positive sign for the market and investors on the equity market. The dovish speech translated into less interest-rate hike next year.
Monthly chart

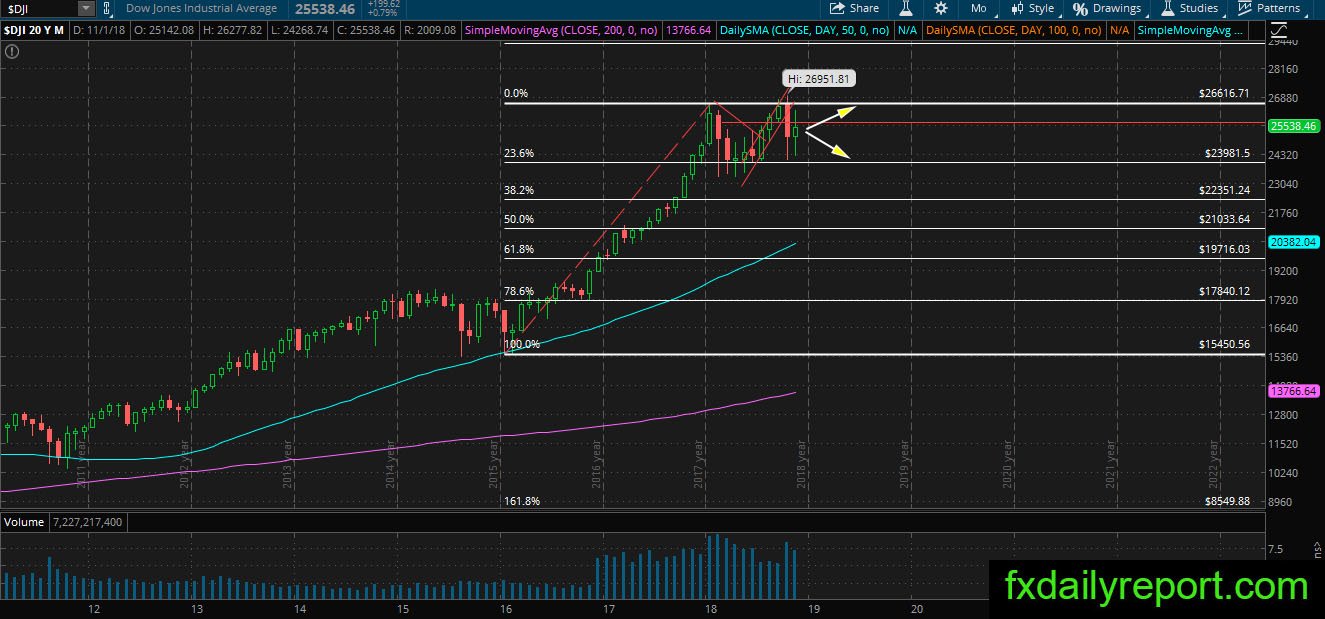
The slide in October creates a bearish engulfing pattern on the DJIA monthly chart. It is a bearish pattern, while at the same month DJIA reaches a new all-time high. The index movement in November mostly about recovery and not showing continuation yet. The next movement trigger might come from The Fed and trade deal between U.S-China this month. Technically, the index will continue its consolidation.
Weekly chart
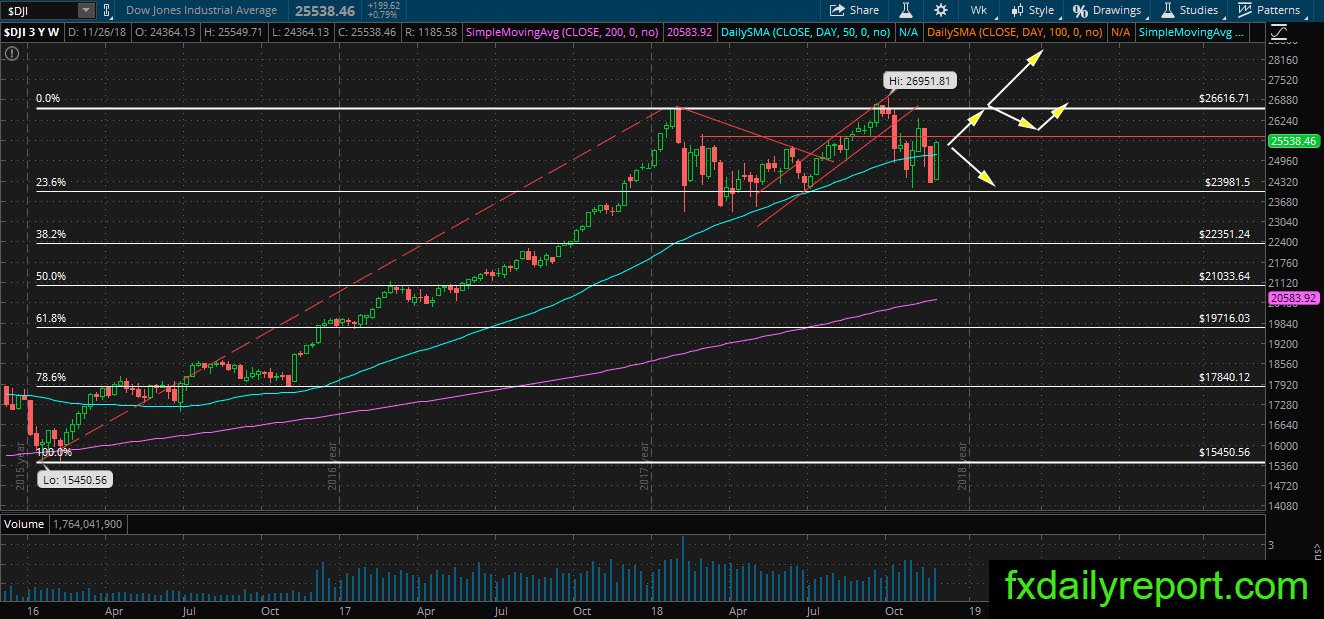
DJIA hovering near its weekly SMA 50 and recently closed bullish above its previous week high. The index seems ready for another bullish attempt to challenge 26,000 and higher. Traders could continue to watch the index movement at the weekly SMA 50 and 24,000 – 26,000 range in December.
Daily chart
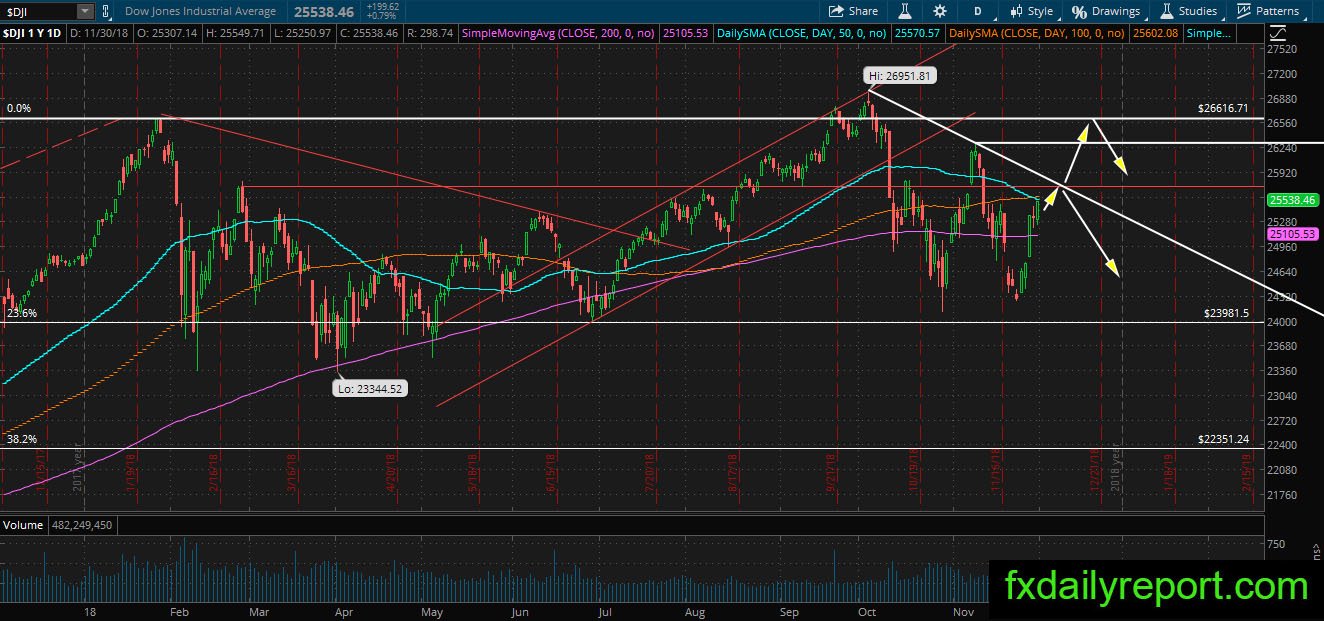
The upside scenario in DJIA daily chart looks prospective however we might see limited upside as the index almost reach its bearish trendline. If the index rejected from the trendline then we might see another test on the daily SMA 200. On the other hand, a breakout above the trendline could lead the index to test November high.