
DJIA long-term technical analysis
The path of Dow Jones Industrial Averages has been to the upside since July strong upward thrust. Initially, the index losing upside momentum and start correction from 26,616.71 top to reach as low as 23,360.29. Since the correction, the index hovered near the low for several months until July rally.
On the fundamental side, strong economic data helped the index. We have seen job created and unemployment reach a level never seen since 18-years ago. However, the strong economic data become a weapon for President Trump to wage trade wars between U.S-China and allies. It created a rift and increasing tension on the global market.

The trade wars took tolls, especially on the emerging countries. Despite the trade wars situation, it seems DJIA ignoring the situation and ready to challenge the all-time high. This event lead us to another question, does the trade wars help the U.S economy?
We think the index could continue its upward movement supported by the fundamental situation. However, it is a conflicting signal and a widescale trade wars on the long-term could backfire to U.S economy in the end.
Monthly chart

Dow Jones Industrial Averages reached highest point this year at 26,616.71 and correction to its 23.6% Fibonacci Retracement level at 23,981.5 before bouncing up to current level. Currently, the index traded at 26,405.76 and ready to challenge this year high. Despite the bullish outlook, the inability to break above this year high could lead the index corrected lower to the 38.2% – 50% area.
Weekly chart

DJIA on the weekly chart saw moving up for sixth consecutive weeks. The index has not shown indication of weakness and ready to break above this year high. We think DJIA still has the potential to move upside following the strong U.S economic indication. But it is better to stay at the safe side and placing trade only when breakout or rejection happens.
Daily chart
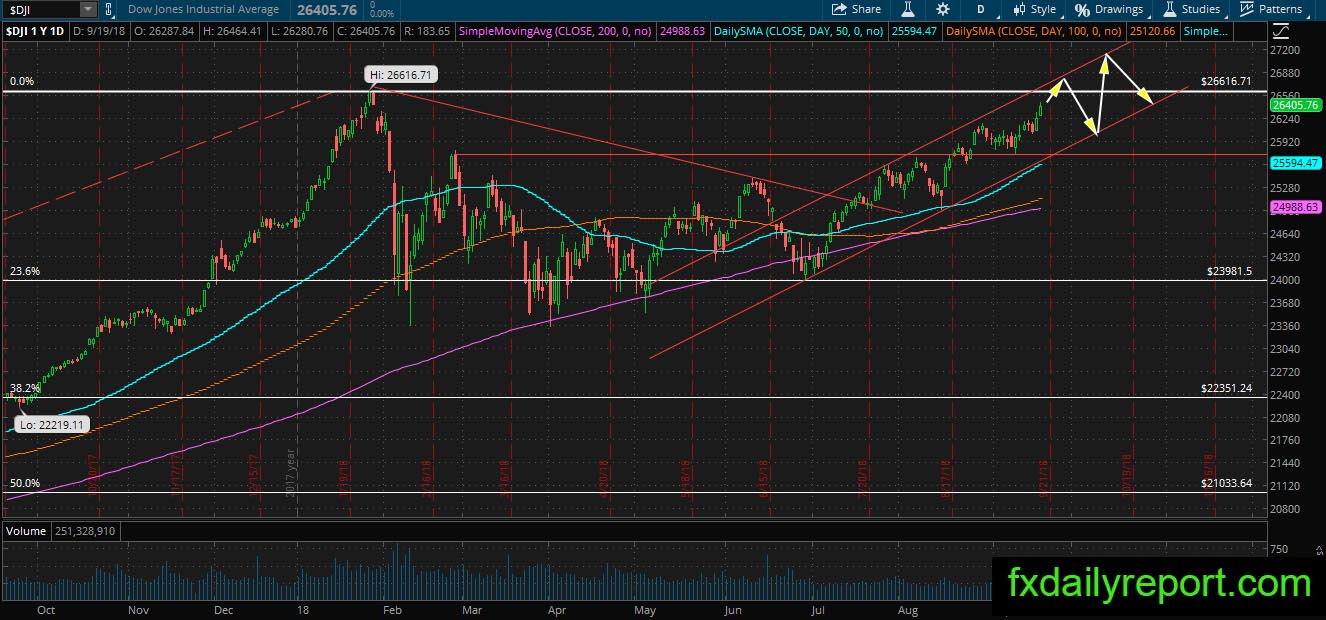
The overall direction on DJIA daily chart is bullish and inside the bullish channel. There is no change in direction yet. Traders will continue to watch the price movement especially when the bull testing this year high. When there is exhaustion or rejection pattern, traders could start placing short position.