
EBAY Long-term outlook

The share prices of EBAY suffered a decline of nearly 40% in 2018 where it fell from as high as $46.99 to close at $28.07. Most bull traders might come under shock to this share prices movement. It is the after-effect of the trade war situation between the U.S and China.

Fortunately, the whole year losses slowly erased this year. At the end of the previous year, trade talks between U.S and China boosted the share prices. Although the path is still rocky, EBAY share prices might start rallying this year. At the current time, both U.S and China enter another talk in G20 meeting. Will both parties reach a deal? EBAY next trending movement will depend on the result of the meeting.
New Month
Monthly chart
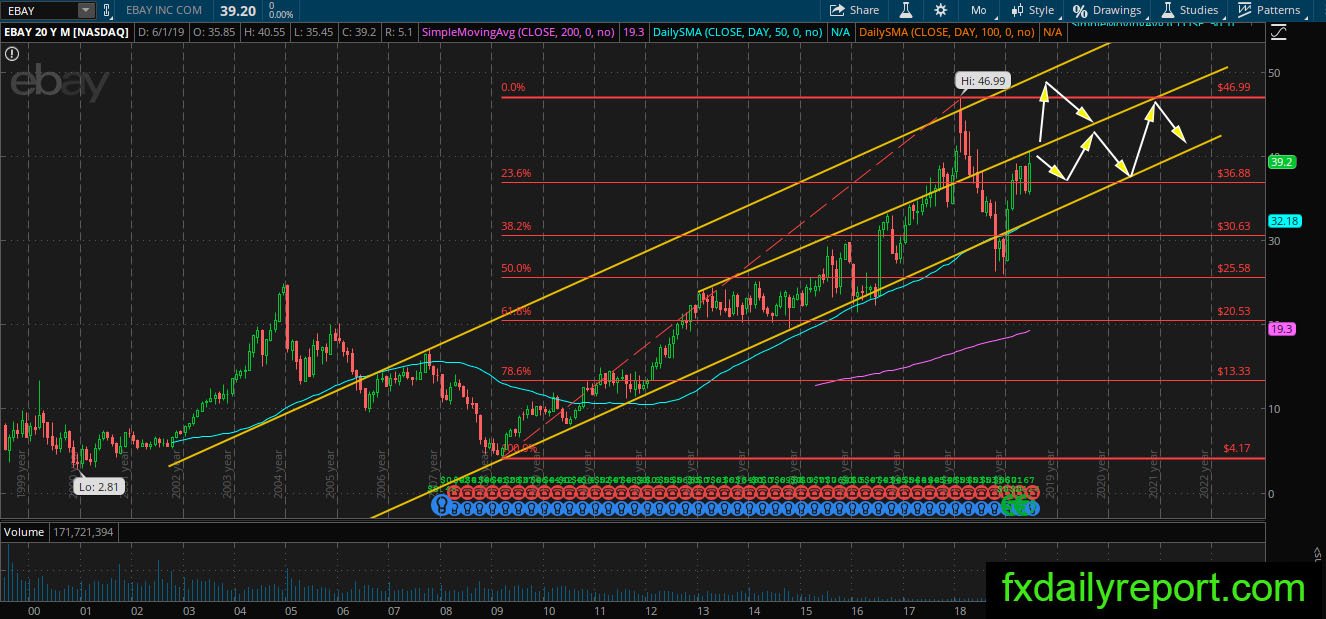
EBAY share prices trend continue bullish inside the three trendline range. In the previous bearish correction, the share prices moved down to a level near 50% Fibonacci Retracement before it reverses upward. The bounce incites new bullish leg and currently the share prices getting near the middle trendline. No change to the bullish trend yet and EBAY should continue to move higher in the long-term.
Weekly chart
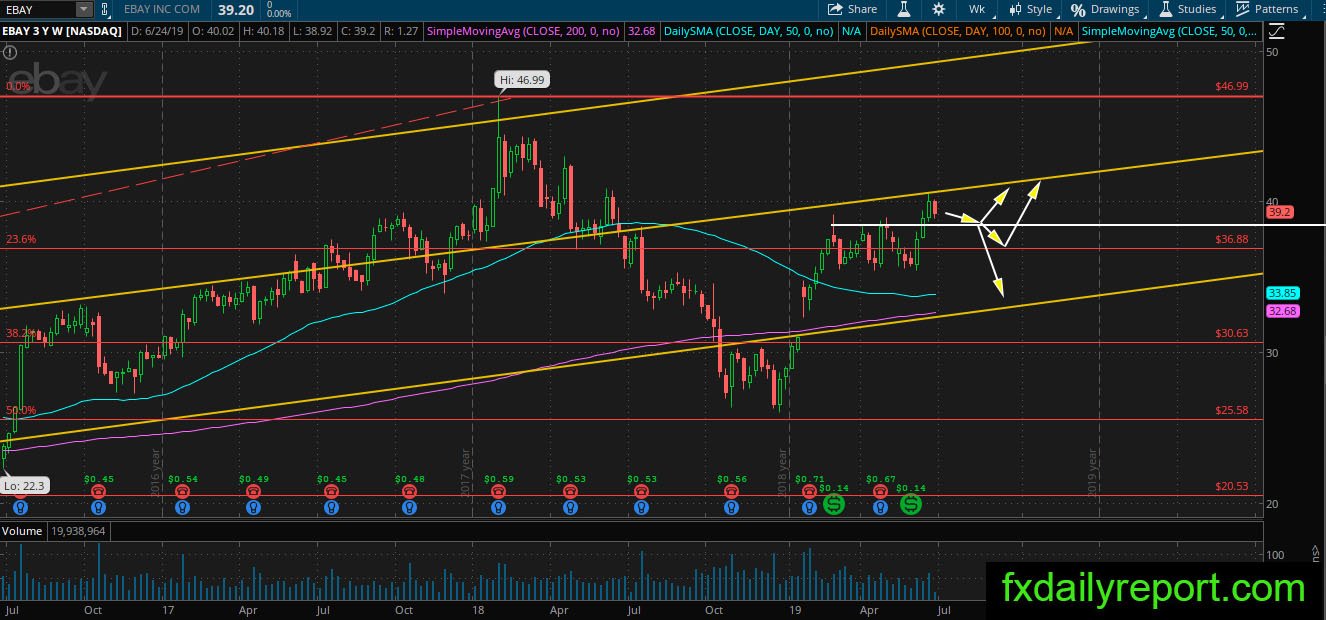
EBAY climbed toward $40.00 on the weekly chart and showed rejection this week. The share prices might move lower to test the level around $38 – $38.50. Traders could prepare for long positions near the area with stop orders below $35.00.
Daily chart
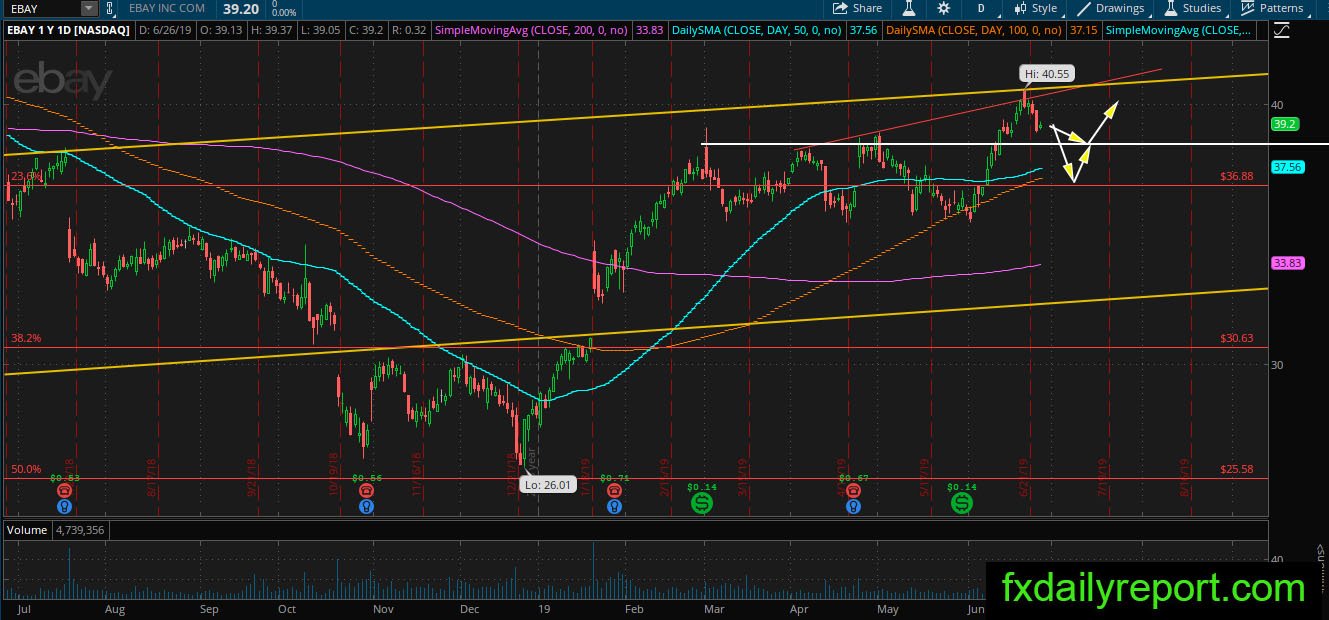
The outlook on the daily chart is similar to the weekly chart. EBAY expected to continue its bearish correction toward $38.00 – $38.50. Traders will monitor the level for a possible chance to enter long positions.
Trade plan
A long position could be taken near $38.00 – $38.50 area.
The short position might need to wait until the trend turns bearish on the monthly chart. The middle trendline on the monthly chart could be considered for potential short.