
The EUR/CHF currency pair rose sharply on Thursday to set a new weekly high of about 1.1050 after bottoming at new multi-year lows of about 1.0950. But on Friday, the pair appears to find strong resistance around 1.1060 level.
It later pulled back to stabilize around 1.1044 in the afternoon forming a short-term consolidative pattern in a sideways channel. In general terms, yesterday’s spike helped the EUR/CHF currency pair to breakout what appears like convex channel curve, which implies a short-term bearish bias.
EUR/USD Fundamentals Overview

From a fundamental perspective, the EUR/CHF currency pair is trading at the back of several economic events. This week, the EU Markit PMI (Preliminary) missed expectations on all counts (Manufacturing and Composite), level on Services) for July.
But on Thursday, the ECB held both the interest rates and the bank deposit rates constant at 0.0% and -0.4% respectively thereby allaying fears of a rate cut. This led to the strengthening in the Euro against major several currencies, which explains yesterday’s spike in the EUR/CHF pair.
EUR/CHF Technical Analysis (the 60-min Chart)
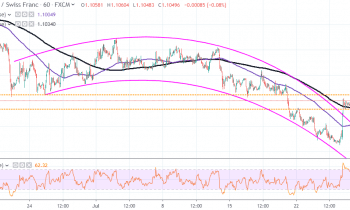
From a technical perspective, the EUR/CHF currency pair appears to have recently hit overbought levels in the Relative Strength Index Indicator. This indicates that the pair could be facing downward pressure amid a lack of bullish momentum.
Therefore, the bears will be more optimistic going into next week and they will target profits at around 1.1033. On the other hand, the bulls will hope that the rebound continues through next week and they will target profits at around 1.1060.
The pair recently crossed the 100-hour and the 200-hour moving average lines from below, which could trigger a trend reversal in a bullish direction.
EUR/CHF Technical Analysis (the Daily Chart)
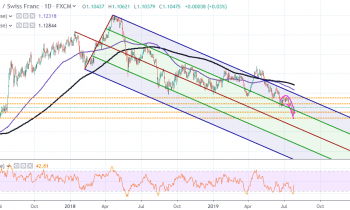
In the daily chart, the EUR/CHF currency pair appears to be trading within a downward movement that started off after a major bull-run. And as demonstrated using Andrews’ Pitchfork, it is currently pegged just above the +50% line after yesterday’s spike.
The pair spent most of the time within the +50% and +100% lines since April, which suggests that the same could continue through next week. This triggers multiple trading opportunities for both the bulls and the bears as demonstrated in the chart.
In summary, with the pair having recently bounced off oversold levels and the 100-day and the 200-day moving average lines well above the pair, things could get more interesting next week.