
On Tuesday, the EUR/CHF currency pair extended this week’s declines to trade at about 0.9306 after the latest EU data. The currency pair trades within a descending channel formation in the 60-minute chart.
The pair has now fallen to trade several levels below the 100-hour moving average line. However, the currency pair still has room left to run before reaching the oversold levels of the 14-hour RSI.
EUR/CHF Fundamentals Overview

From a fundamental perspective, the EUR/CHF currency pair trades during a relatively busy period in the EU market. On Tuesday, the seasonally-adjusted German factory orders for August missed the expected (MoM) change of 1.4% with a change of -0.8%. The non-seasonally adjusted (YoY) equivalent grew by 1.5%, versus a change of -3.3% posted in the previous period.
Earlier in the week, the EU’s Sentix Investor Confidence for October improved to -5.4, up from -9.2 in the previous update. The EU retail sales for August matched the forecasted (MoM) change of 0.1%, compared to a change of -0.4% in the previous period. The (YoY) equivalent was lower at 1% versus 2.1% in the previous update.
Looking forward, traders will be waiting for the German industrial production data for August on Wednesday, ahead of the country’s August trade balance, expected on Thursday.
EUR/CHF Technical Analysis (the 60-min Chart)
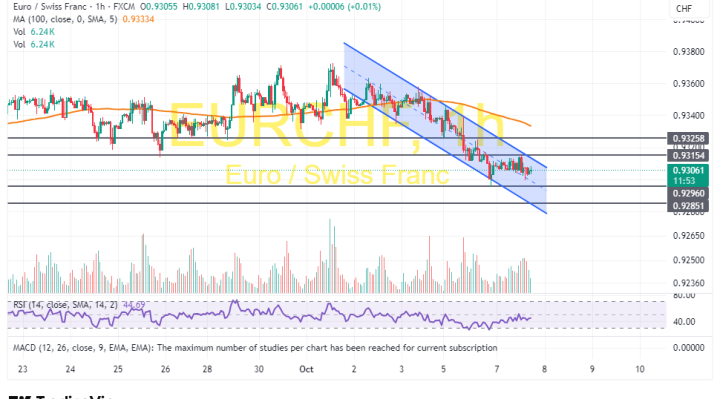
Technically, the EUR/CHF currency pair trades within a descending channel formation in the 60-minute chart. However, the 14-hour RSI still has room left to run before reaching the oversold conditions of the indicator.
Therefore, the bears will look to stretch the current run of declines toward 0.9296 or lower to 0.9285. On the other hand, the bulls will look to pounce on potential rebounds at about 0.9315 or higher at 0.9325.
EUR/CHF Technical Analysis (the Daily Chart)
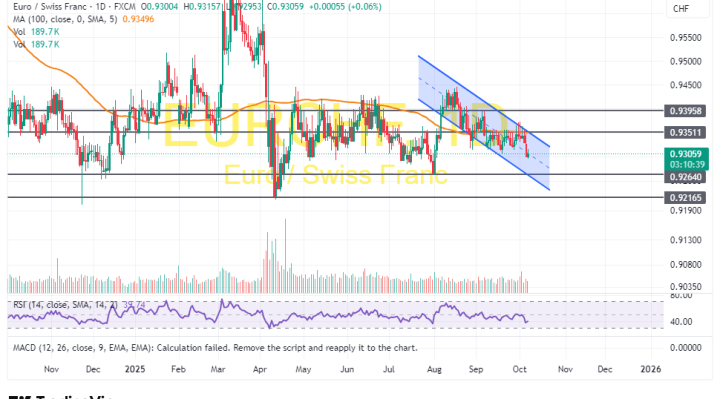
In the daily chart, the EUR/CHF currency pair trades within a descending channel formation. The 14-day RSI also supports a long-term bearish bias as it edges closer to oversold conditions.
Therefore, the bears will look to extend the latest pullback towards 0.9264 or lower to 0.9216. On the other hand, the bulls will look to pounce on profits at about 0.9351 or higher at 0.9395.