
The EUR/CHF currency pair on Wednesday pulled back from the current weekly highs of about 1.0985 to trade at around 1.0965. This came following the latest round of EU data. The pair appears to be on a rebound after plunging last week.
It has now surged to trade just above the 23.60% fib level after touching on the 38.20% on Tuesday. It remains pinned between the 100-hour and the 200-hour SMA lines in the 60-min chart. The latest pullback prevented the currency pair from crossing to the overbought levels of the 14-hour RSI.
EUR/CHF Fundamentals Overview

From a fundamental perspective, the EUR/CHF currency pair is trading at the back of a relatively busy period in the EU market. On Wednesday. Germany’s harmonized index of consumer prices for April matched the (YoY) expectations of 2.1%. The (MoM) equivalent also came in line with 0.5%. On the other hand, the EU Industrial Production for March missed the (MoM) expectation of 0.7% with 0.1%. The (YoY) equivalent also came short of 11.7% with 10.9%. France CPI for April missed both the (MoM) and (YoY) forecasts while Germany’s Equivalents matched estimates.
Earlier in the week, the EU ZEW Survey economic sentiment for May beat the expectation of 71.2 with 84. Germany’s current sentiment for May also outshone -41.3 with -40.1 while the economic sentiment beat 72 with 84.4. Italy’s Industrial output for March beat 37.2% with 37.7% (YoY) while the (MoM) change came short of 0.4% with -0.1%.
EUR/CHF Technical Analysis (the 60-min Chart)
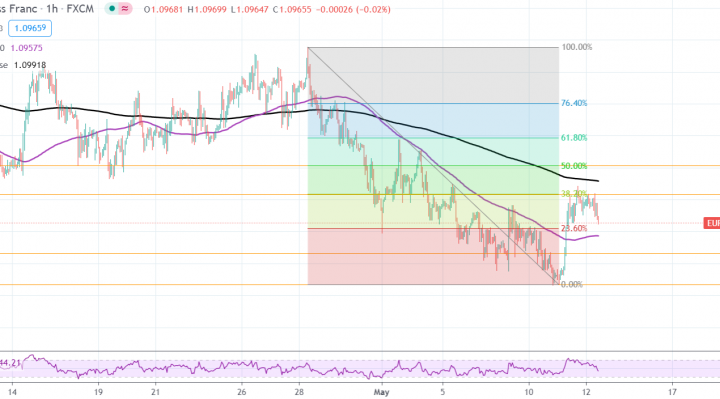
Technically, the EUR/CHF currency pair appears to have recently bounced back after a major pullback last week. The currency pair is now pinned just above the 23.60% fib level after pulling back from 38.20%.
The bulls will be targeting short-term profits at around 38.20% and 50% fib levels at 1.0983 and 1.1000, respectively. On the other hand, the bears will be looking to pounce for profits at around 1.0946 or lower at the 0.00% fib level at 1.0927.
EUR/CHF Technical Analysis (the Daily Chart)
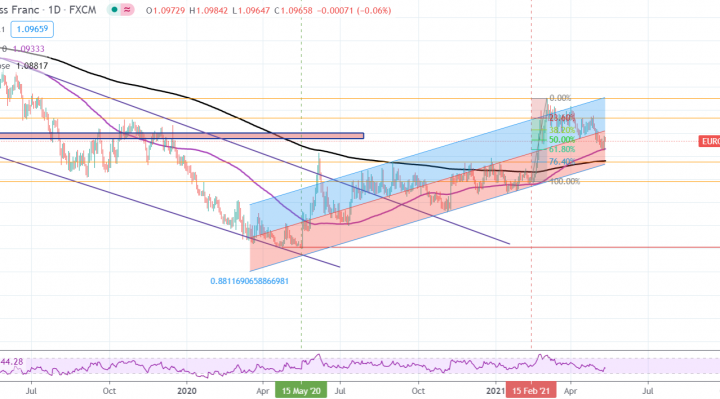
In the daily chart, the EUR/CHF appears to be trading within an ascending trend formation. It has recently bounced back to avoid crossing to oversold levels of the 14-day RSI. The recent pullback has pushed it to the 50% fib level, just above the 100-day SMA.
The bulls will be targeting long-term profits at around 23.60% and 0.00% fib levels at 1.1067 and 1.1151, respectively. On the other hand, the bears will look to pounce for pullbacks at around 76.40% and 100% fib levels at 1.0877 and 1.0790, respectively.