
The EUR/CHF currency pair on Friday pulled back off 1.0800 to trade at around 1.0761 after the latest round of EU GDP data missed market expectations. The currency pair continues to trade within relatively sideways channels with significant levels of volatility.
The currency pair is now pegged between the 100-hour and the 200-hour SMA line sin the 60-min chart. This indicates that the sideways movement could continue for the foreseeable future.
EUR/CHF Fundamentals Overview

From a fundamental perspective, the EUR/CHF currency pair is trading at the back of a relatively busy period in the EU market. On Friday the seasonally adjusted preliminary EU GDP for Q2 missed the (QoQ) expectation of -12% with -12.1%. It also came short of the (YoY) expectation of -14.5% with -15%. On the other hand, the preliminary core CPI for July beat the (YoY) expectation of 0.8% with 1.2% while the general CPI outperformed 0.2% with 0.4%. On Thursday, the EU unemployment rate for June also came short of the expectation of 7.7% with 7.8%.
In Switzerland, the Swiss, ZEW survey expectations for July beat 39.4 with 42.4 while retail sales missed the (YoY) expectations for June with 1.1% versus 3.9%. On the other hand, the KOF leading indicator for July outperformed the expectation of 75 with 85.7. This was a significant improvement from a reading of 60.6 posted in the previous period.
EUR/CHF Technical Analysis (the 60-min Chart)
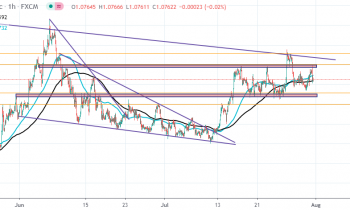
Technically, the EUR/CHF currency pair appears to be trading within a sideways channel in the 60-min chart. This indicates a lack of clear short-term directional momentum in the market sentiment.
The bulls will be targeting the next short-term rebound for profits at around 1.0800 or higher at 1.0829. On the other hand, the bears will look to pounce on short-term profits at around 1.0728 or higher at 1.0699.
EUR/CHF Technical Analysis (the Daily Chart)
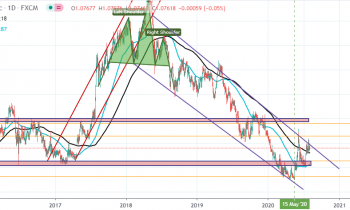
In the daily chart, the EUR/CHF currency pair appears to be trading within a sharply descending channel. This indicates a long-term bearish bias in the market sentiment. The pair has recently rebounded to surge above the 100-day and the 200-day SMA lines.
The bears will be targeting long-term pullback profits at around 1.0657 or lower at 1.0529. On the other hand, the bulls will look to extend rebound beyond the trendline resistance to 1.0857 or higher towards 1.0961.