
EUR/GBP long-term technical analysis
The plan to ditch stimulus by ECB might be postponed as the situation around the global market develops slowly. In December, The Fed turned dovish by telling the market they will be patient in raising interest-rate. Current forecast sees no rate-hike in the U.S at least until the second quarter.
Aside from interest-rate topic, ECB will focus on the next central banker who will replace Mario Draghi when he leaves office in October.

The UK also nearing the deadline for March Brexit. The time is ticking and recent Brexit deal by Theresa May voted down. Fortunately, the Prime minister won a vote of confidence after the Brexit deal voted down. Currently, the PM scheduled talk with EU to delay Brexit deal before another vote.
EUR/GBP might move with wild direction nearing actual Brexit.
Click here to read previous EUR/GBP long-term technical analysis
New Month
Monthly chart
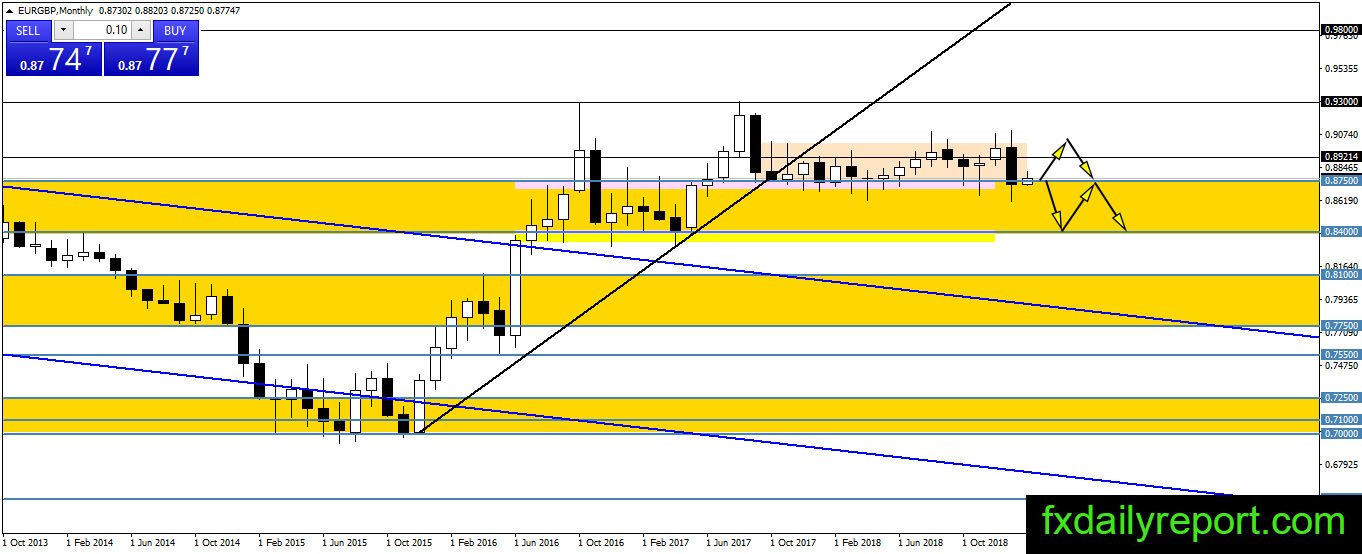
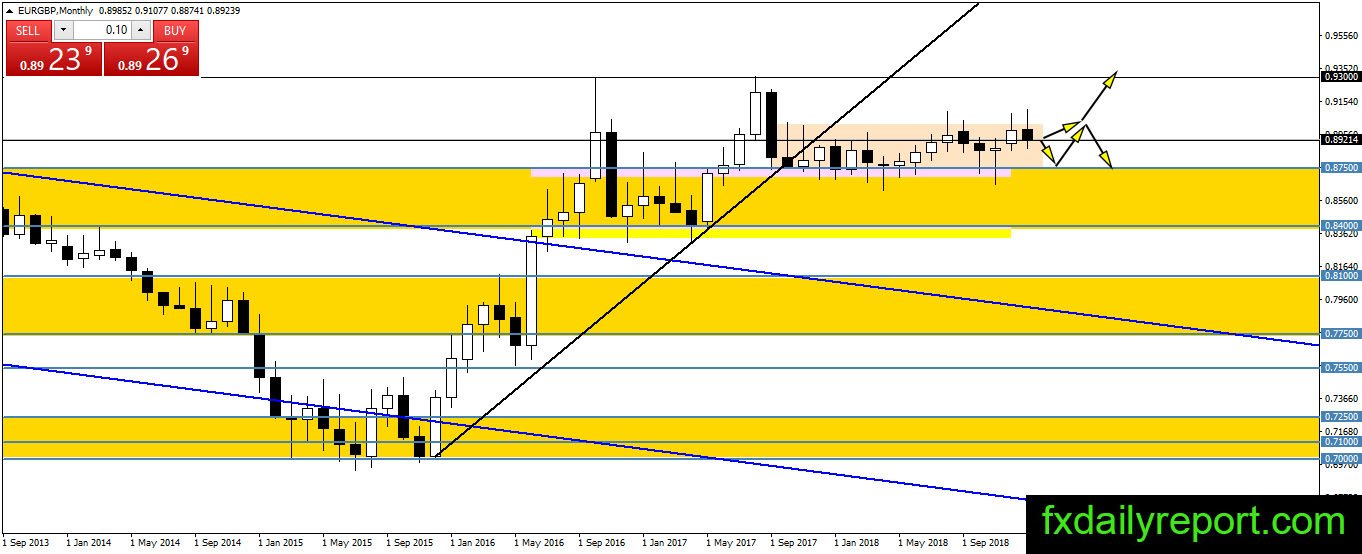
EUR/GBP rejected from the top of the pink box and headed to the bottom of the box only in one month. The pair closed below the box and enter the 0.8400 – 0.8750 area. It is now attempting to move back and reclaim the level above 0.8750. February movement might stick near 0.8750 and next month movement will depend on where EUR/GBP close.
Weekly chart
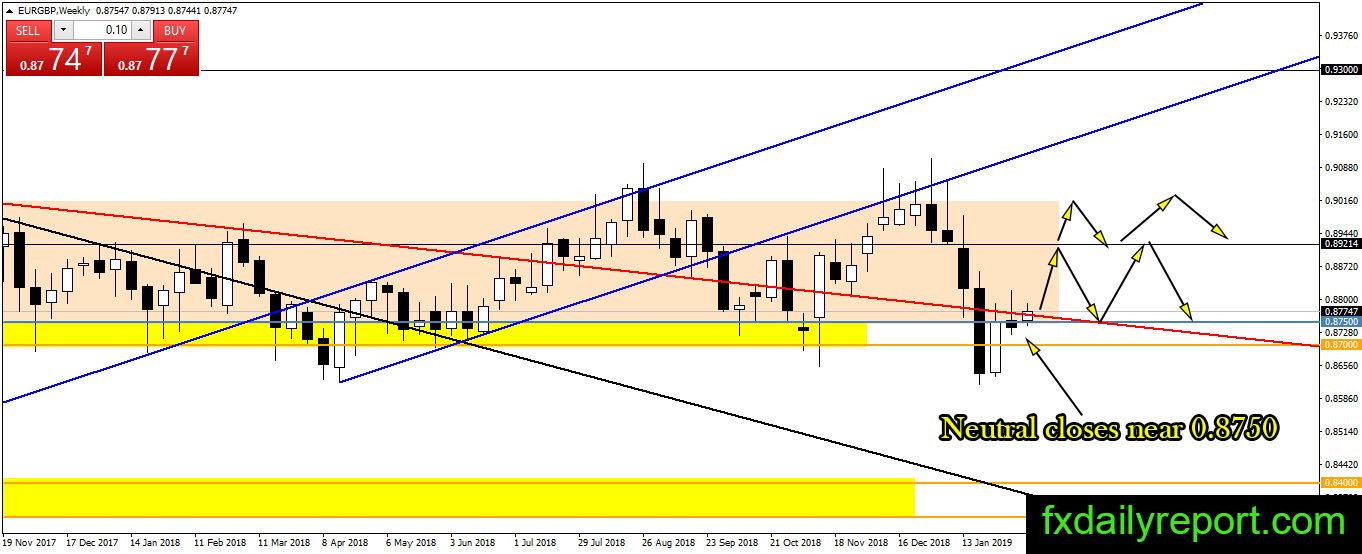
On the weekly chart, we have a better picture on EUR/GBP current situation. The pair slides below 0.8750 and closes with significant distance. However, in the second week, the bull brought the pair up and closed near 0.8750. On the third week, there was bullish attempt but could not close above 0.8750. This week, the pair climb above 0.8750, if it could close above 0.8750 and previous week high then EUR/GBP ready to rally toward 0.9000.
Daily chart
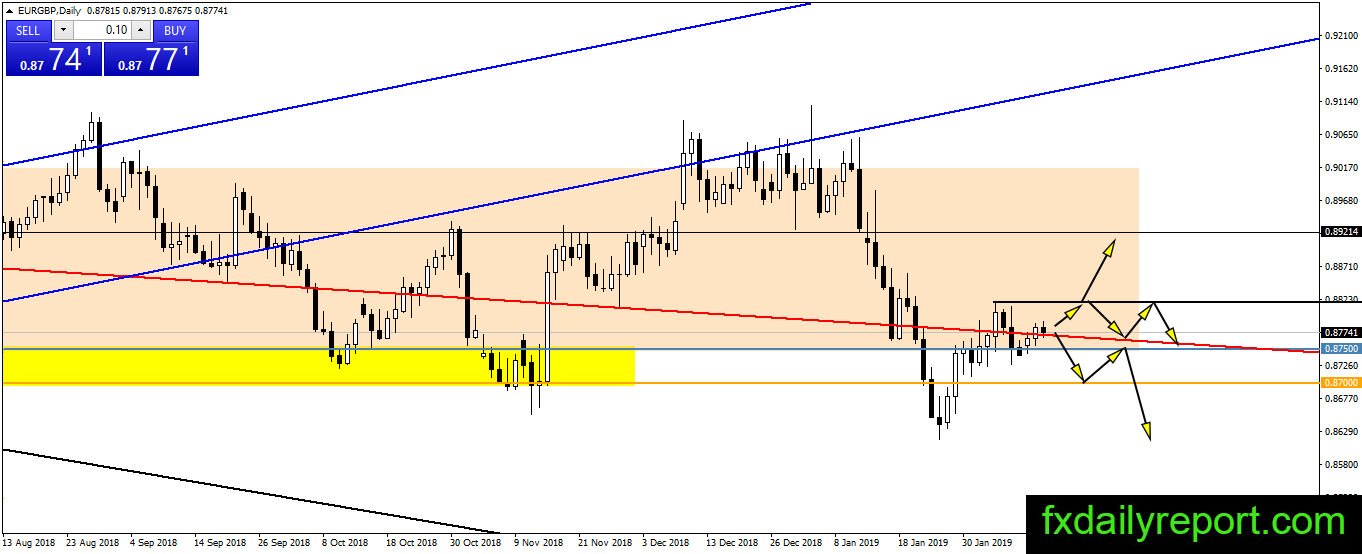
EUR/GBP on the daily chart defended near 0.8750 from further downside. However, the pair could not print a higher high. If the pair crossed 0.8750 and low around 0.8726 then it might resume the bearish leg. At the current time, there is no confirmation yet.
Trade plan
EUR/GBP is under consolidation period where the pair stick near the bottom of 0.8700 – 0.9000 area. Previous downward movement dent the support and the pair reach as low as 0.8616. It is a strong bearish sign and currently, the bull could not lift from 0.8750 with strong momentum.
At the current time, long position near 0.8700 – 0.8750 still favored. However, traders might also need to consider the breakout scenario below the support area for short positions.