
EUR/GBP long-term technical analysis
ECB has announced in December the stop of its massive stimulus going into January. However, there was change in the Fed outlook toward the interest-rate plan. Previously, the Fed optimistic they will raise interest-rate three to four times in 2019. But, the testimony in December previous year shows more dovish outlook rather than hawkish.
The change in The Fed sentiment might postpone the stop of ECB stimulus in January. At the current time, the central bank urged to maintain the stimulus options open in the face of uncertainties.

On the UK account, the country enters another vote for Brexit deal. This vote will determine how the Brexit proceed. “No” means the UK will face hard Brexit which the market want to avoid at any cost. We will wait for the result.
Click here to read previous EUR/GBP long-term technical analysis
New Month
Monthly chart
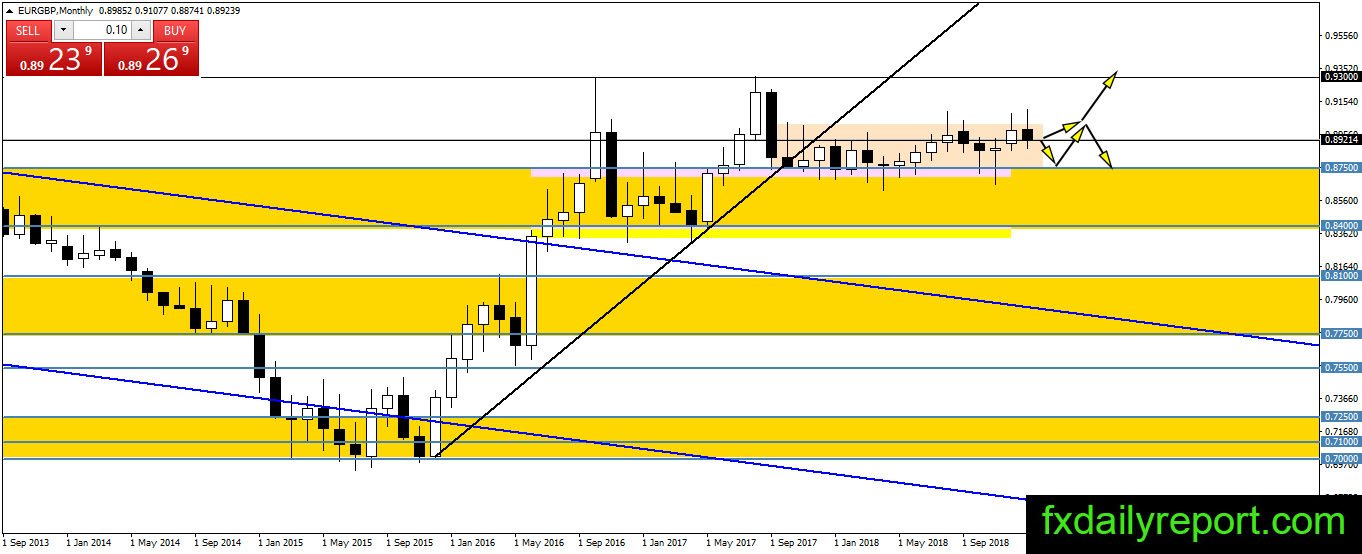
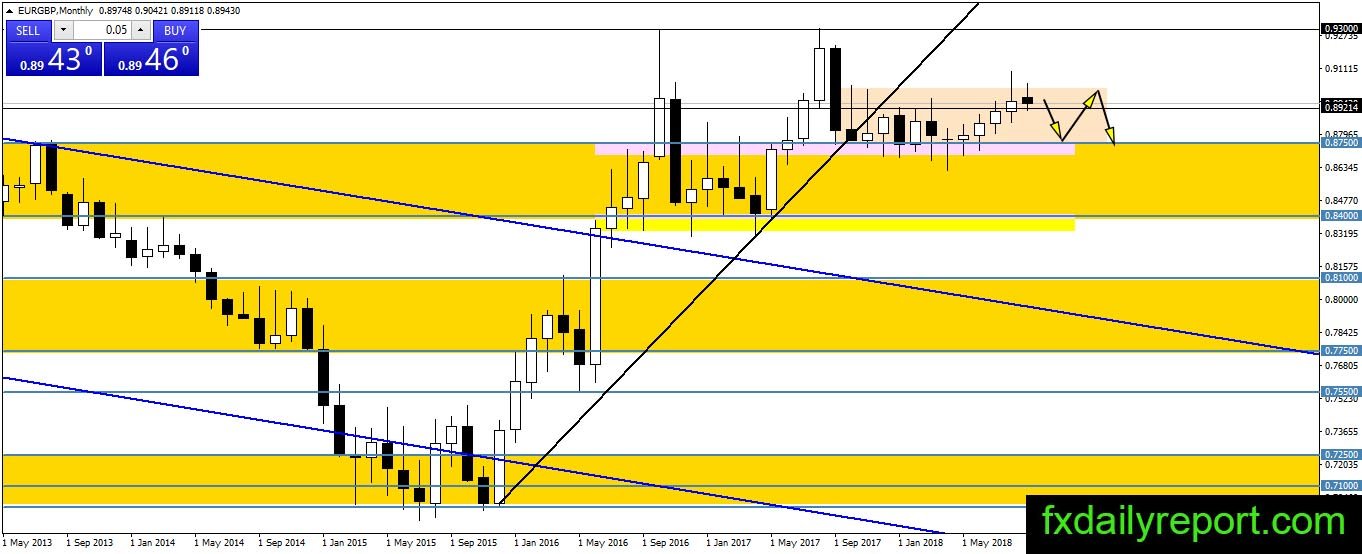
EUR/GBP still trapped inside the box area since previous long-term analysis on July 2018. The pair moving back and forth and currently rejected from the top of box. No change to the outlook of the pair which is sideways and traders could look for an opportunity to take short positions.
Weekly chart
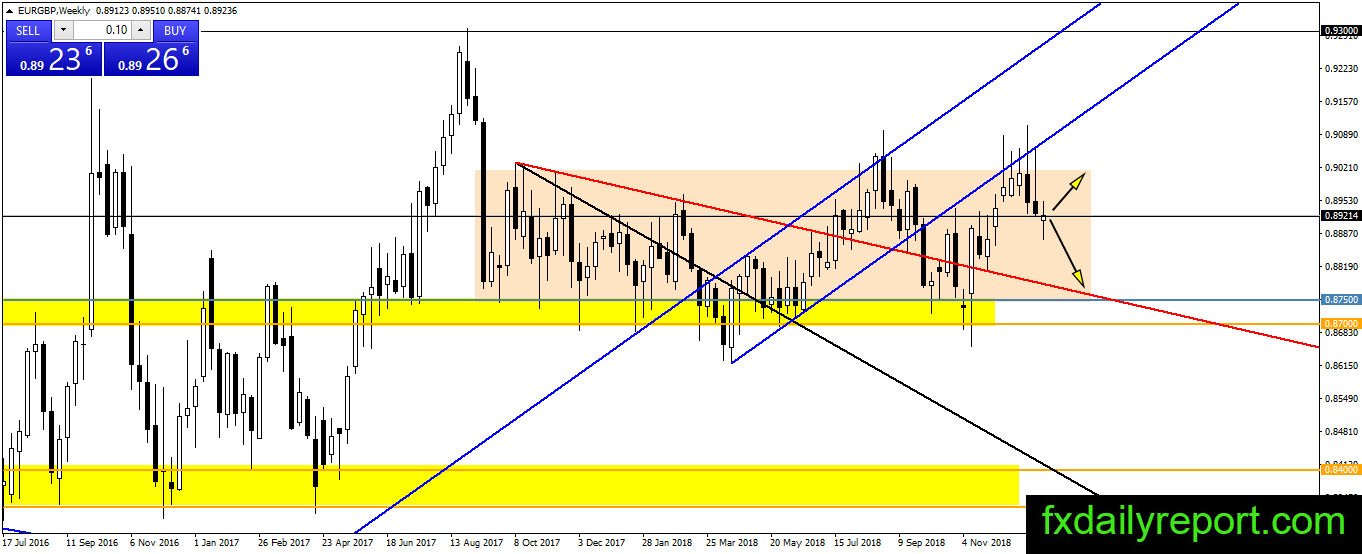
The weekly chart show downside breakout of the blue channel and the pair bounced from 0.8700 – 0.8750 area. The upward movement later stalled at the bottom of the channel and resistance 0.9000 or top of the pink box. It is currently testing 0.8920 and showing a bullish reaction. Will the pair bounce from 0.8920 and test 0.9000?
Daily chart
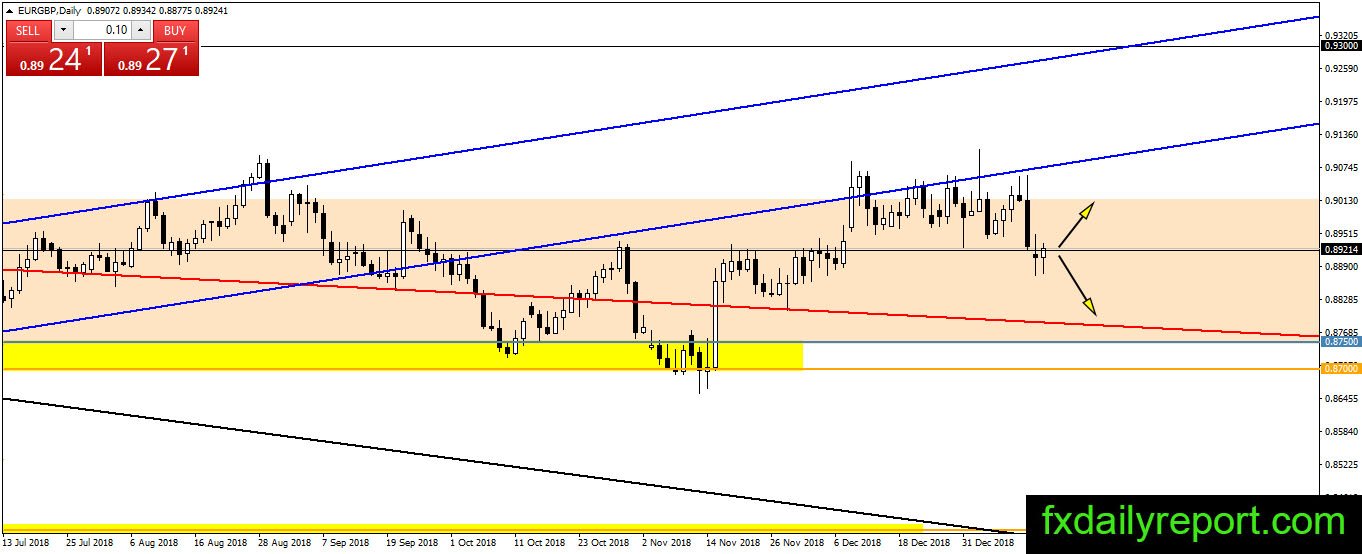
The outlook on EUR/GBP daily chart is similar to the weekly chart. Traders will wait for reaction at current 0.8920 level. The pair might stick near the level until momentum movement created.
Trade plan
On the long-term view, the most favorable scenario is to trade the pink box range between 0.8700 – 0.9000 until breakout happens. This month, Brexit news and ECB rate decision might become the trigger news for EUR/GBP movement.